

TLDR
- Aster (ASTER) fell 3.26% in 24 hours and 9.83% over the week, now trading around $1.16-$1.18.
- Coinbase added ASTER trading on October 19, bringing increased liquidity and market exposure.
- The token holds above key $1.10-$1.13 support with technical indicators suggesting a potential bounce.
- Exchange data shows $1.49 million in net inflows on October 18, reversing weeks of outflows.
- Price targets include $1.50 and $1.80 if support holds, but breaking $1.10 risks a drop to $1.00.
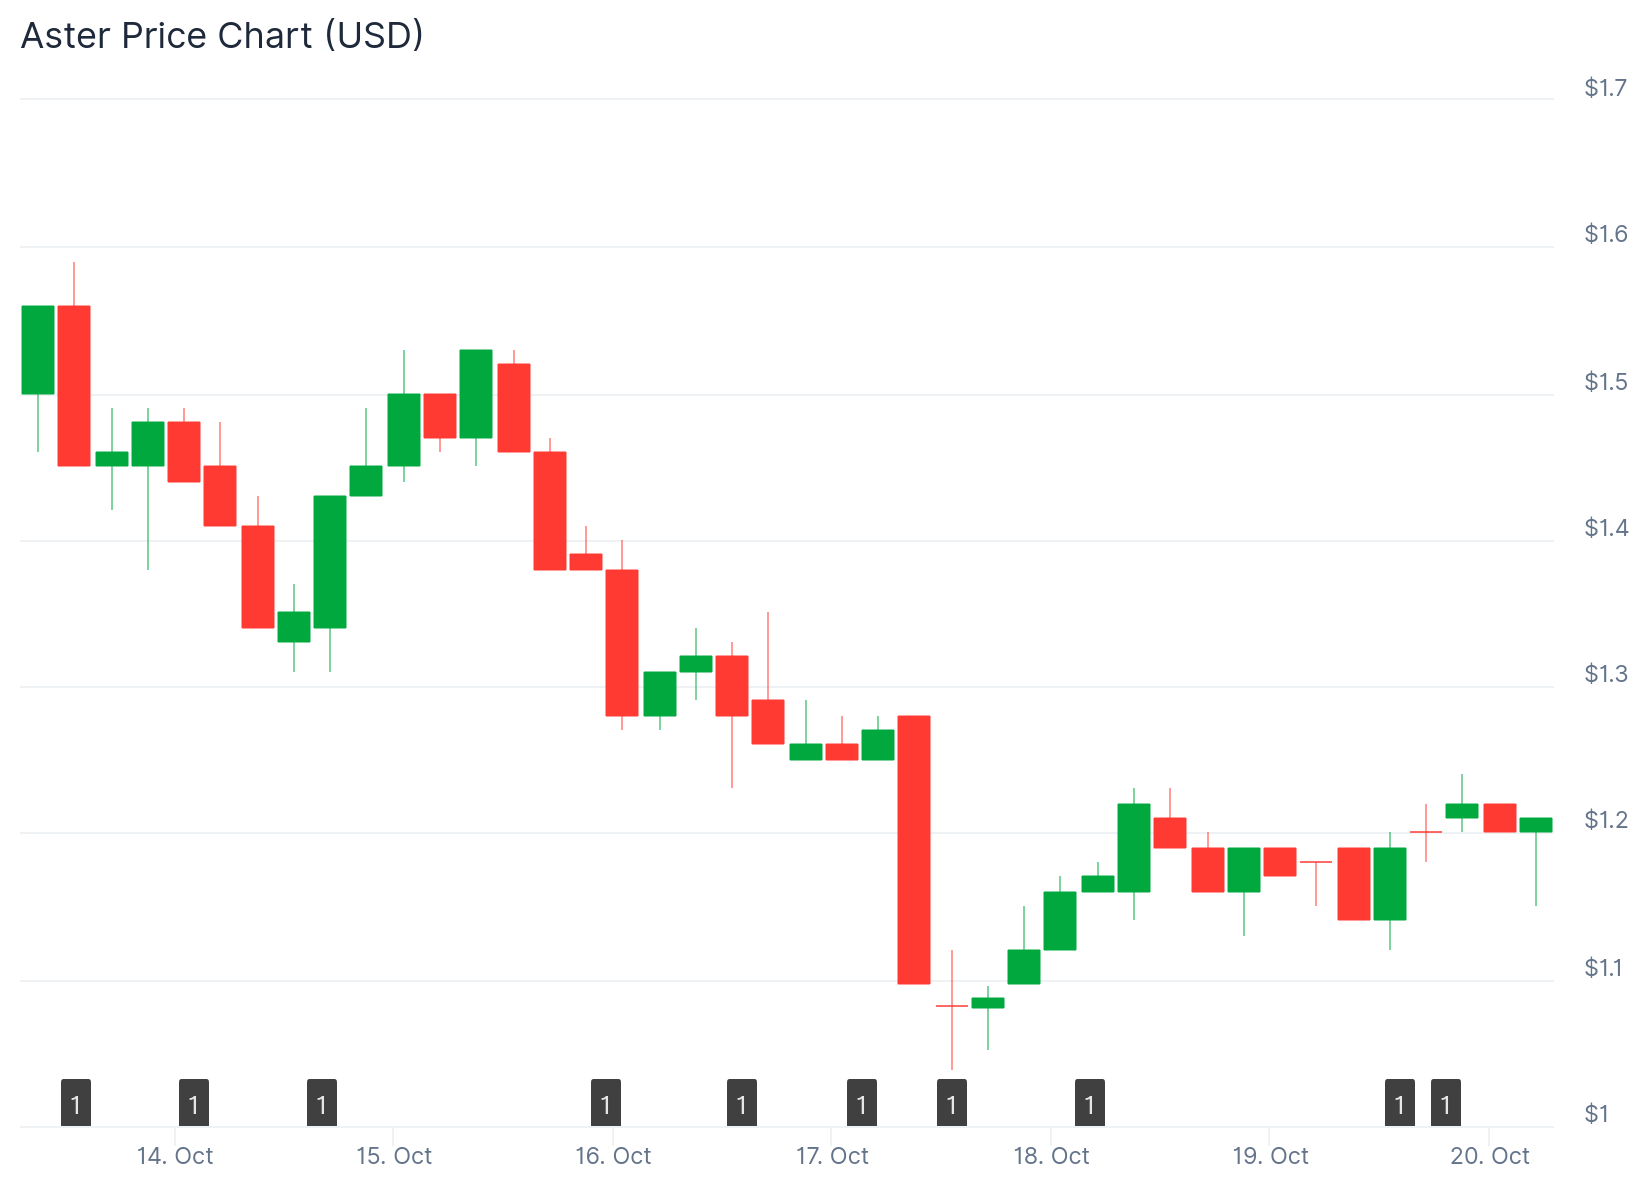
Aster is currently trading between $1.16 and $1.18 after experiencing a 3.26% decline over the past 24 hours. The token has faced increased selling pressure throughout the week, with losses totaling 9.83%.
Trading volume for ASTER reached $478.73 million in the last 24 hours. This figure represents a sharp 58.82% decrease compared to the previous trading session. The market capitalization now sits at $2.37 billion, reflecting a 3.46% decline.
On October 19, Coinbase officially began offering ASTER trading to users in eligible regions. The listing on one of the world’s largest cryptocurrency exchanges opens the door for increased trading activity. Market participants expect higher volatility as fresh capital enters the market.
The exchange continues expanding its token offerings to meet growing trader demand. This development provides ASTER with broader access to retail and institutional investors.
Critical Support Level Holds Firm
ASTER continues to trade just above a crucial support zone between $1.10 and $1.13. The token has successfully defended this level across multiple trading sessions. Buyers have stepped in each time the price approached this range.
Technical analysis from crypto analyst @CryptoKaviYT indicates the token recently crossed above a downward trending line. This pattern often precedes short-term price recoveries. The analyst highlighted potential targets at $1.50 and $1.80 if the current support zone remains intact.

However, resistance levels pose challenges for upward movement. The token faces a cluster of exponential moving averages acting as resistance. The 20, 50, 100, and 200 EMAs are positioned at $1.17, $1.19, $1.26, and $1.37 respectively.
A breakout above $1.25 would signal a short-term reversal of the descending pattern. Failure to break this resistance could trigger another test of the $1.10 level.
Technical Indicators Point to Early Recovery
The MACD indicator on the 4-hour chart shows a fresh bullish crossover. The histogram turned positive at 0.01089, suggesting buying momentum may be building. Both the MACD and signal lines remain below the zero line, indicating the recovery phase is still developing.
The Relative Strength Index currently reads 43.05, climbing from oversold territory. The RSI now trades above its moving average of 38.19, showing reduced selling pressure. The indicator has not yet crossed above the neutral 50 level, meaning buyers have not established full control.
On shorter timeframes, the Supertrend indicator flipped neutral near $1.19. The Parabolic SAR shows resistance between $1.18 and $1.20, an area that has capped recent recovery attempts.
Fresh Inflows Signal Buyer Interest
Data from Coinglass reveals $1.49 million in net inflows on October 18. This marks the first positive inflow reading after multiple sessions of heavy outflows. Previous days saw outflows exceeding $10 million as traders took profits.
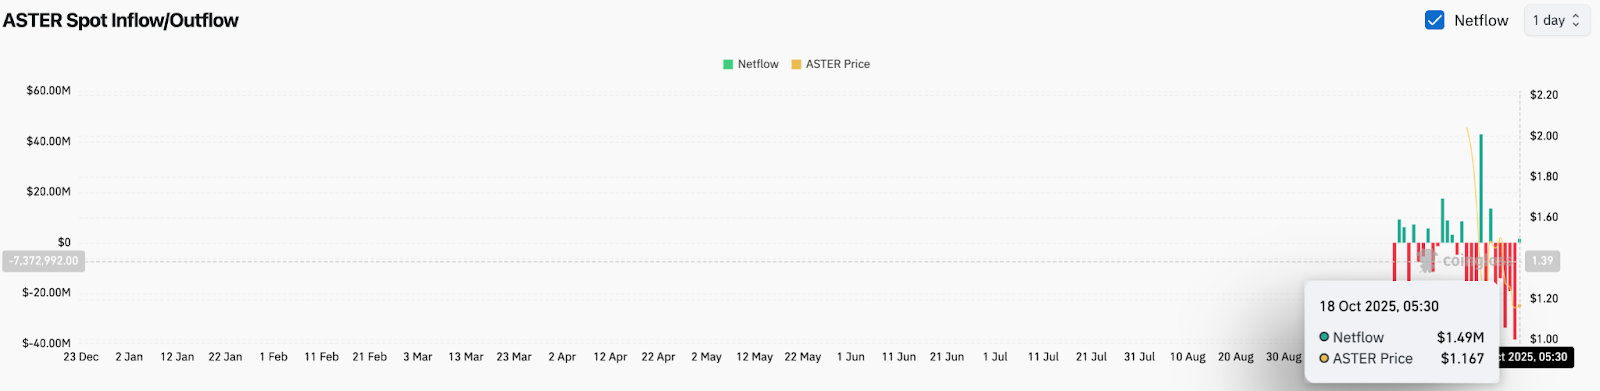
The modest inflow suggests early accumulation near the channel floor. Sustained daily inflows above $5 million would provide stronger confirmation of renewed buying interest.
If ASTER breaks above $1.25, the next resistance levels sit between $1.30 and $1.35. The 200 EMA at $1.37 represents a critical pivot for confirming a trend change. Breaking below $1.10 would invalidate the recovery structure and expose the $1.00 support zone.
Get 3 Free Stock Ebooks
Discover top-performing stocks in AI, Crypto, and Technology with expert analysis.
- Top 10 AI Stocks - Leading AI companies
- Top 10 Crypto Stocks - Blockchain leaders
- Top 10 Tech Stocks - Tech giants

