
 Rallies as Futures Activity Spikes and Technical Indicators Turn Bullish")
Key Highlights
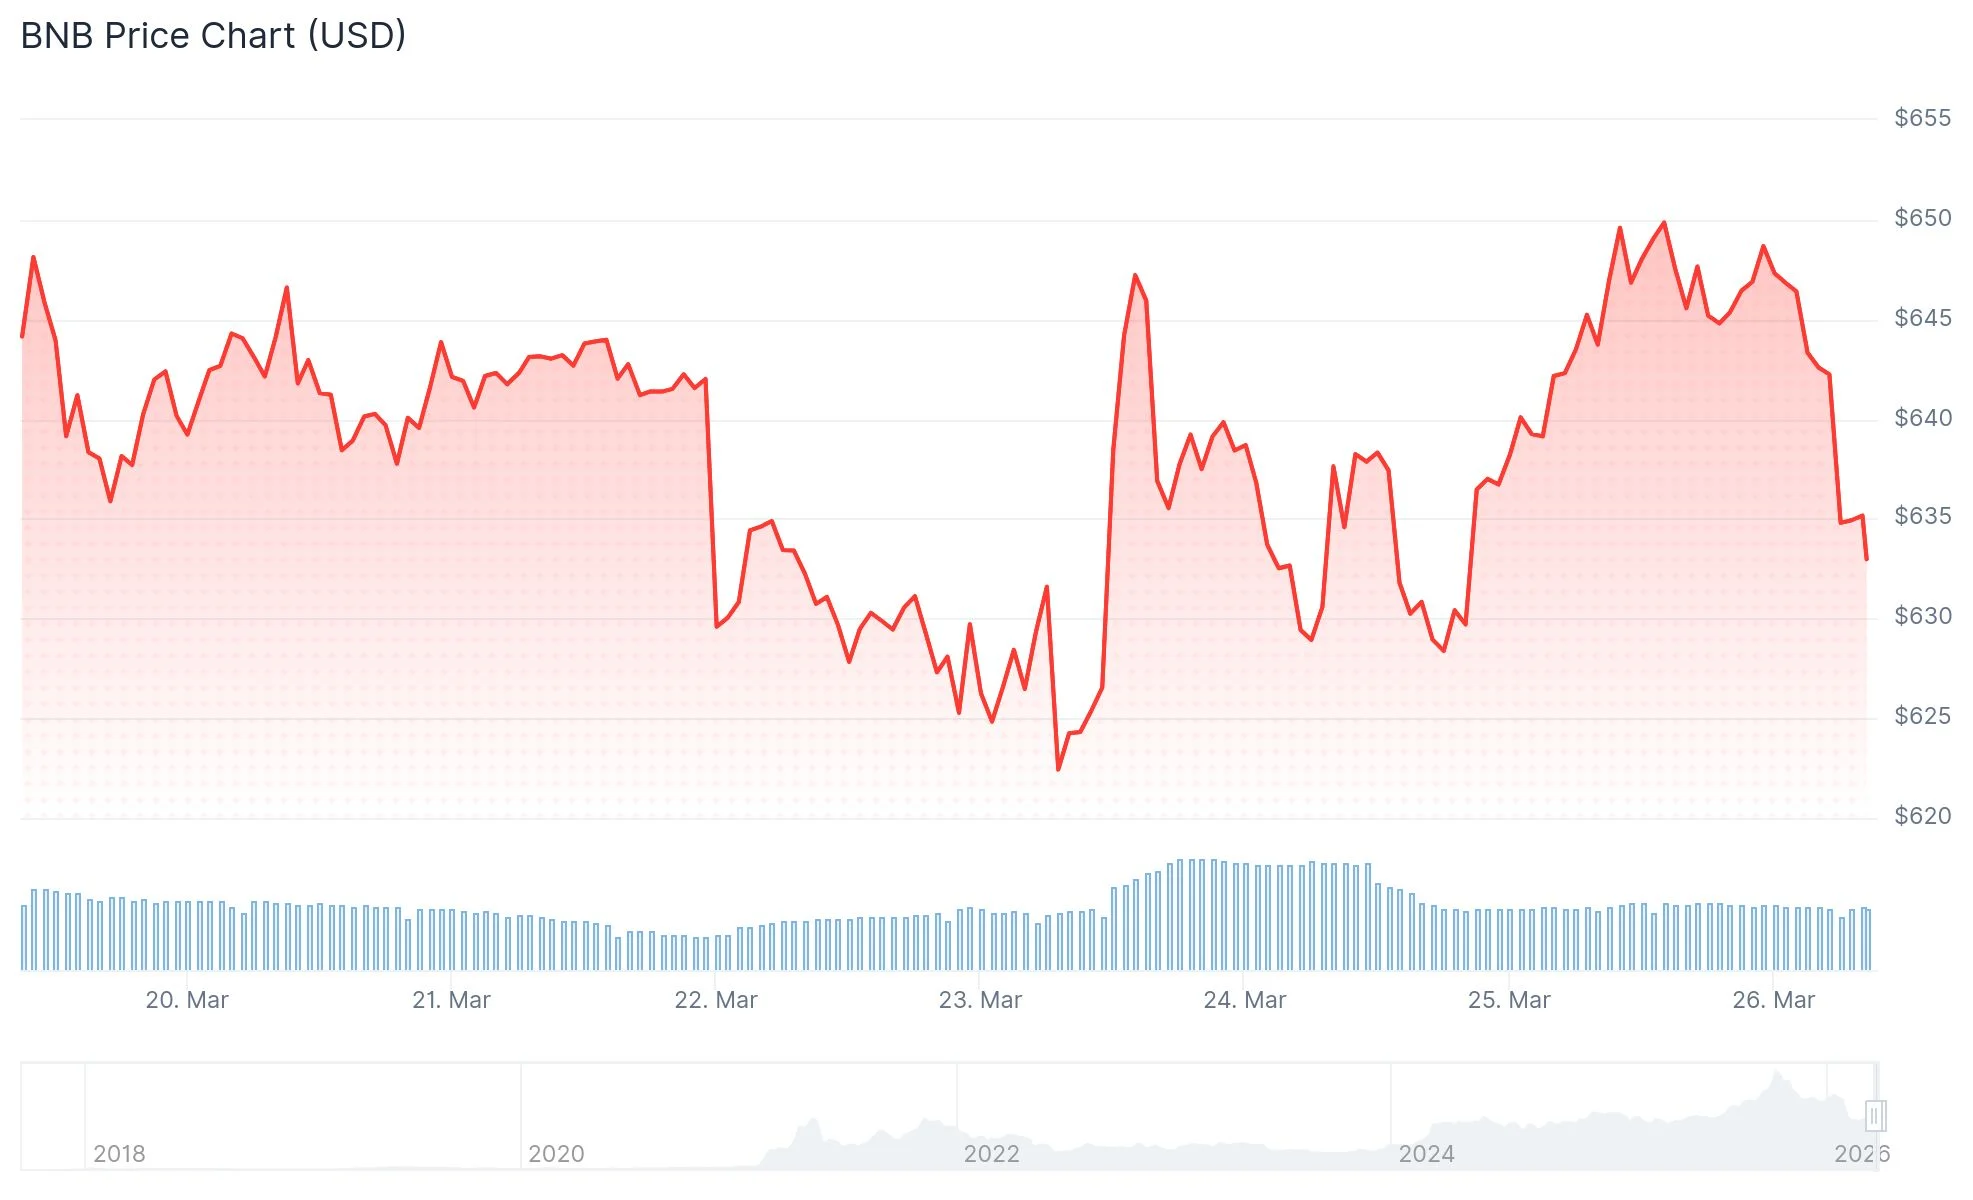
- Binance Coin recovered from $627 to approximately $648, benefiting from strengthened market conditions.
- Futures open interest for BNB jumped 6.5% to reach $923 million, while Binance’s long/short ratio exceeded 2.21.
- The token maintains support above a crucial rising trendline and continues trading within a bullish channel pattern on daily timeframes.
- A bullish crossover occurred with the 20-day SMA moving above the 50-day SMA, while BNB remains 53% off its peak price.
- Market analysts project price objectives between $2,000 and $5,000, drawing from historical cycles and blockchain metrics.
Binance Coin reversed from a weekend bottom of $627 and rallied to approximately $648 by Monday, March 25. This rebound occurred alongside improving cryptocurrency market conditions as geopolitical concerns between the U.S. and Iran showed signs of de-escalation.
Energy markets reflected reduced tensions as crude oil declined from above $100 to roughly $87 per barrel. During this timeframe, Bitcoin surged past $71,000 while Ethereum neared the $2,200 threshold. Equity markets across Asia, including Japan’s Nikkei 225, Hong Kong’s Hang Seng, and the Shanghai Composite, experienced positive momentum.
According to CoinGlass derivatives data, BNB’s open interest expanded by 6.5% within a 24-hour window, reaching $923 million. On Binance specifically, the long/short ratio registered above 2.21, indicating that bullish positions outnumber bearish ones by more than two to one.
Chart Patterns Suggest Continued Bullish Momentum
Analyzing the daily timeframe reveals BNB trading inside an ascending parallel channel structure. The token has successfully defended its lower channel boundary, which has provided dynamic support across multiple weeks.
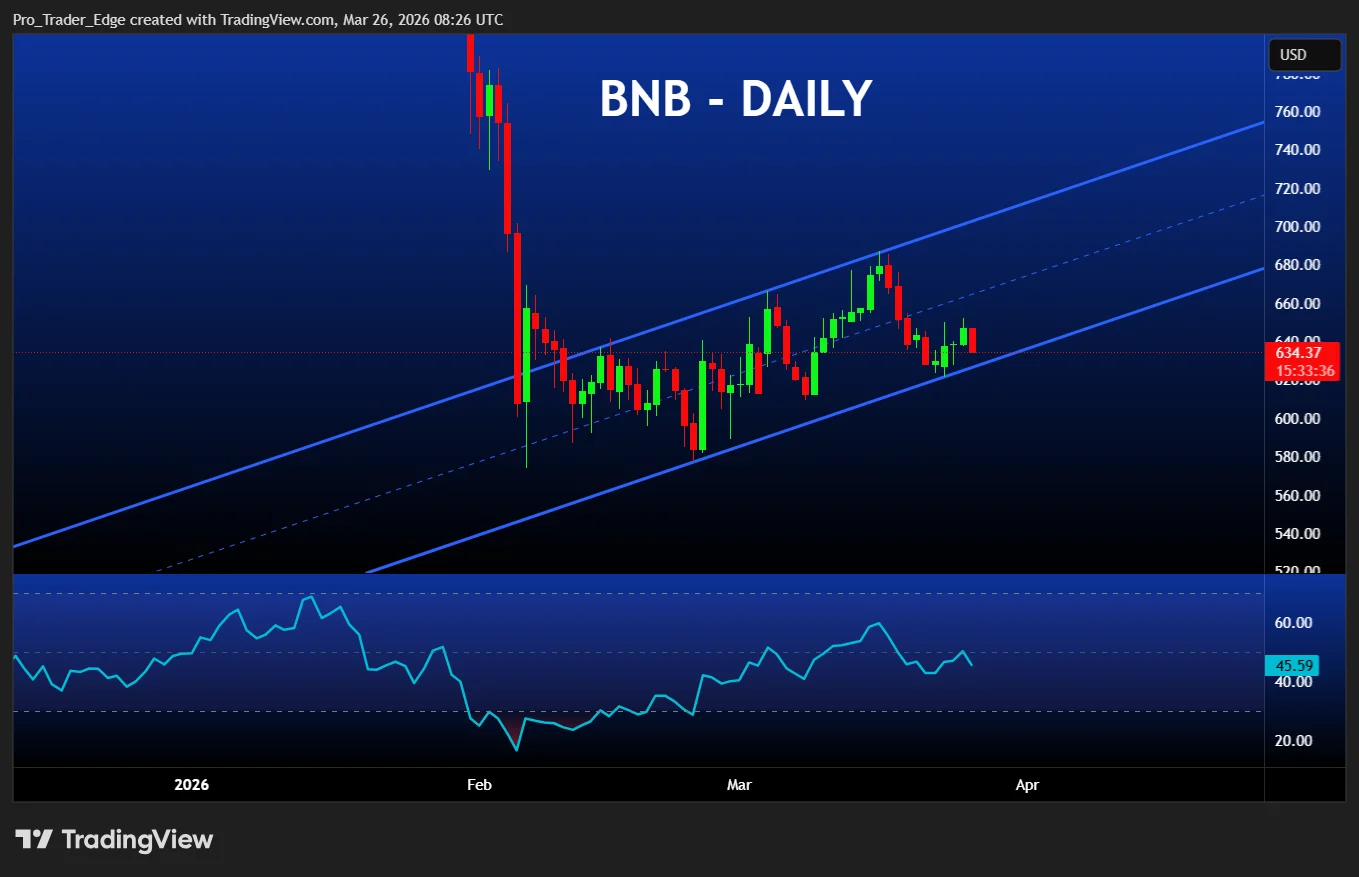
A significant development emerged as the 20-day simple moving average crossed above the 50-day SMA. This bullish crossover typically indicates strengthening short-term momentum favoring buyers. Meanwhile, the relative strength index (RSI) approaches neutral territory, suggesting additional upside potential remains available.

Traders are monitoring $685 as the immediate resistance barrier, a price level where BNB encountered multiple rejections during earlier March trading. Successfully breaching this threshold could pave the way toward the 100-day SMA positioned near $750. Should prices fall beneath $600, the prevailing bullish framework would face serious challenges.
With current prices 53% below its historical peak, BNB offers substantial recovery potential assuming favorable market conditions persist.
Crypto analyst Patel highlighted BNB’s 53% discount from its all-time high, citing historical price patterns, ongoing token burn mechanisms, and robust underlying fundamentals to support ambitious long-term projections of $2,000, $5,000, and potentially $10,000, while identifying $300 to $420 as an ideal accumulation range.
Token Burns and Platform Utility Drive Sustained Demand
BNB maintains utility throughout the Binance ecosystem, where it serves multiple functions including transaction fee payments, trading fee discounts, and various blockchain applications, generating consistent demand pressure.
The cryptocurrency implements systematic token burn events that progressively decrease total circulating supply. Market analysts interpret these deflationary mechanics favorably for long-term price appreciation, particularly when combined with expanding blockchain usage metrics.
The previously established accumulation zone spanning $300 to $420 has been cleared, and certain cycle-based analytical models now suggest potential targets ranging from $2,000 to $5,000. These forecasts derive from historical market patterns and structural analysis.
As of March 26, BNB trades around $648 with critical support at $600 holding firm.
Get 3 Free Stock Ebooks
Discover top-performing stocks in AI, Crypto, and Technology with expert analysis.
- Top 10 AI Stocks - Leading AI companies
- Top 10 Crypto Stocks - Blockchain leaders
- Top 10 Tech Stocks - Tech giants

