
 Dominates Gold and S&P 500 Performance During U.S.-Iran Conflict")
TLDR
- BTC fell 8.5% at the onset of U.S.-Iran hostilities but has rebounded approximately 11% from its bottom.
- With every new escalation in the conflict, Bitcoin experiences selling pressure yet discovers support at progressively higher levels.
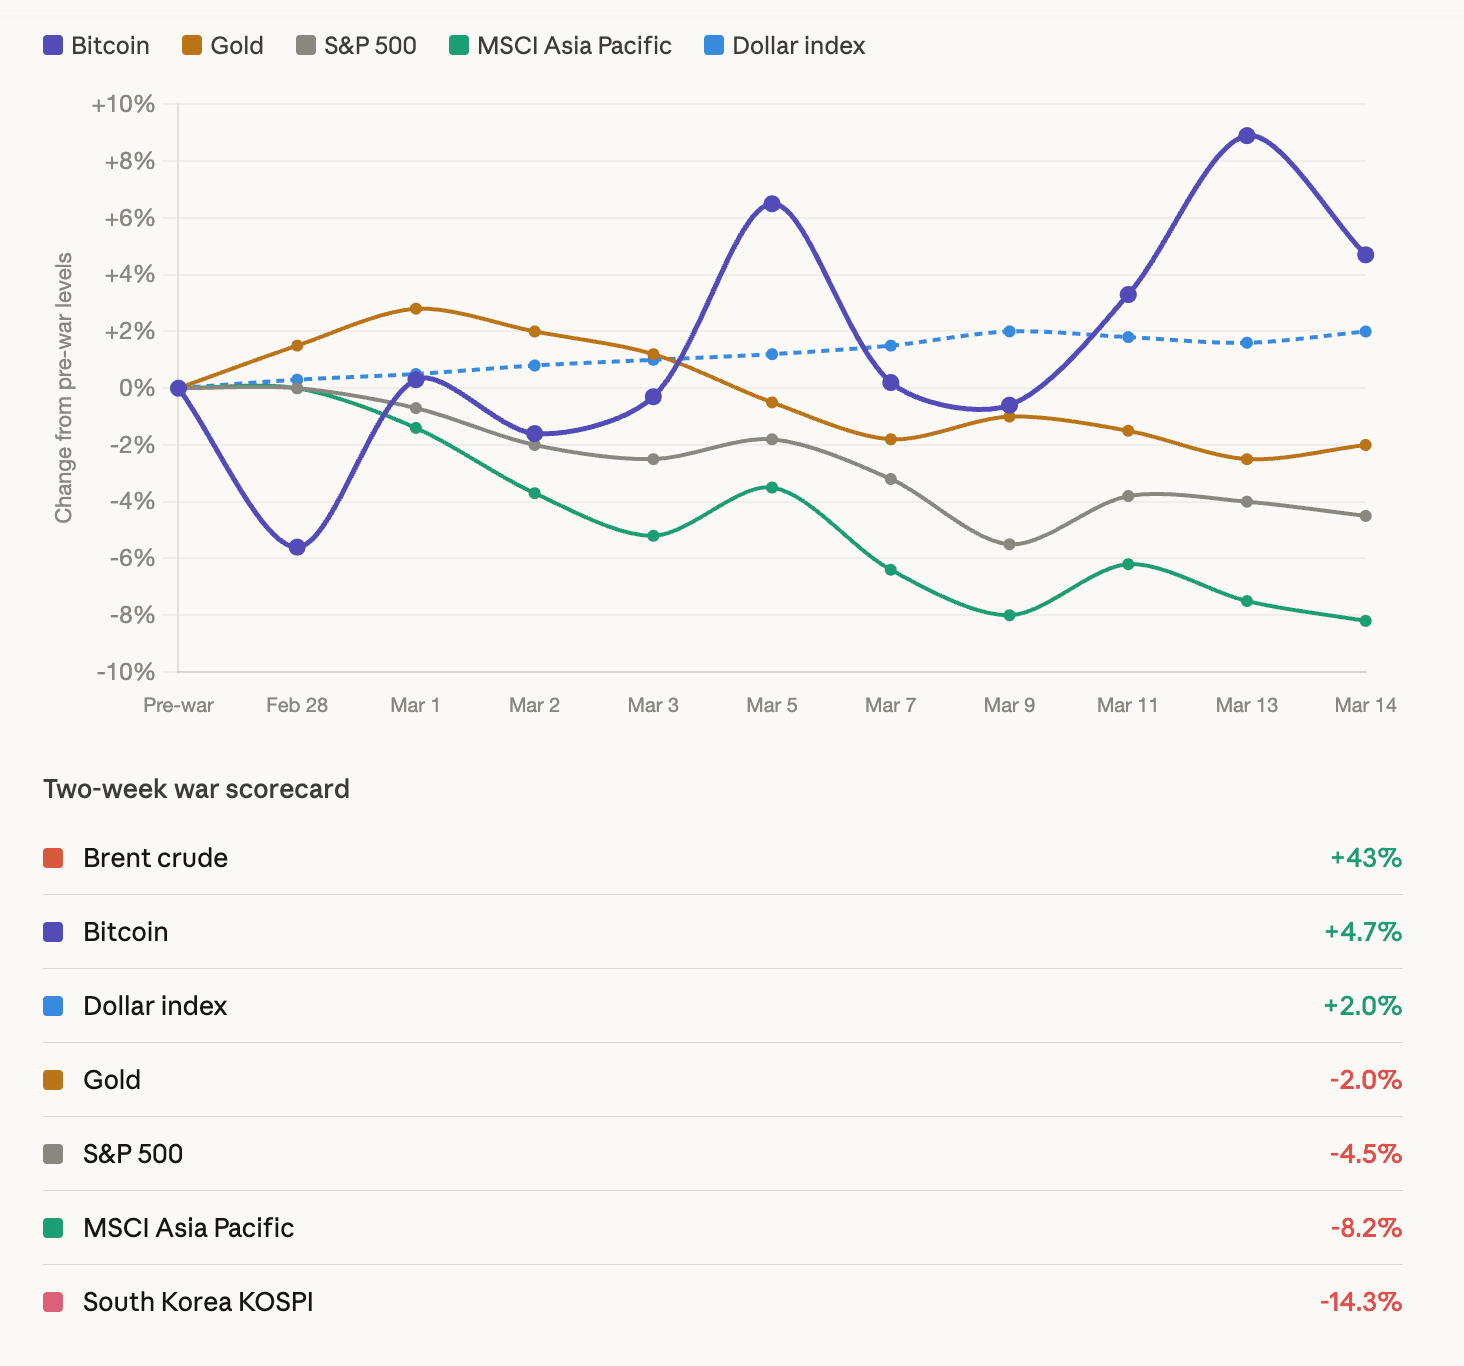
- Bitcoin’s performance has exceeded both gold and the S&P 500 during this two-week timeframe.
- Whales—holders of substantial Bitcoin wallets—have resumed accumulation around $71,000, now possessing 68.17% of all BTC.
- Blockchain metrics indicate minimal overhead resistance until approximately $82,000.
Bitcoin’s current market price stands at $71,500.
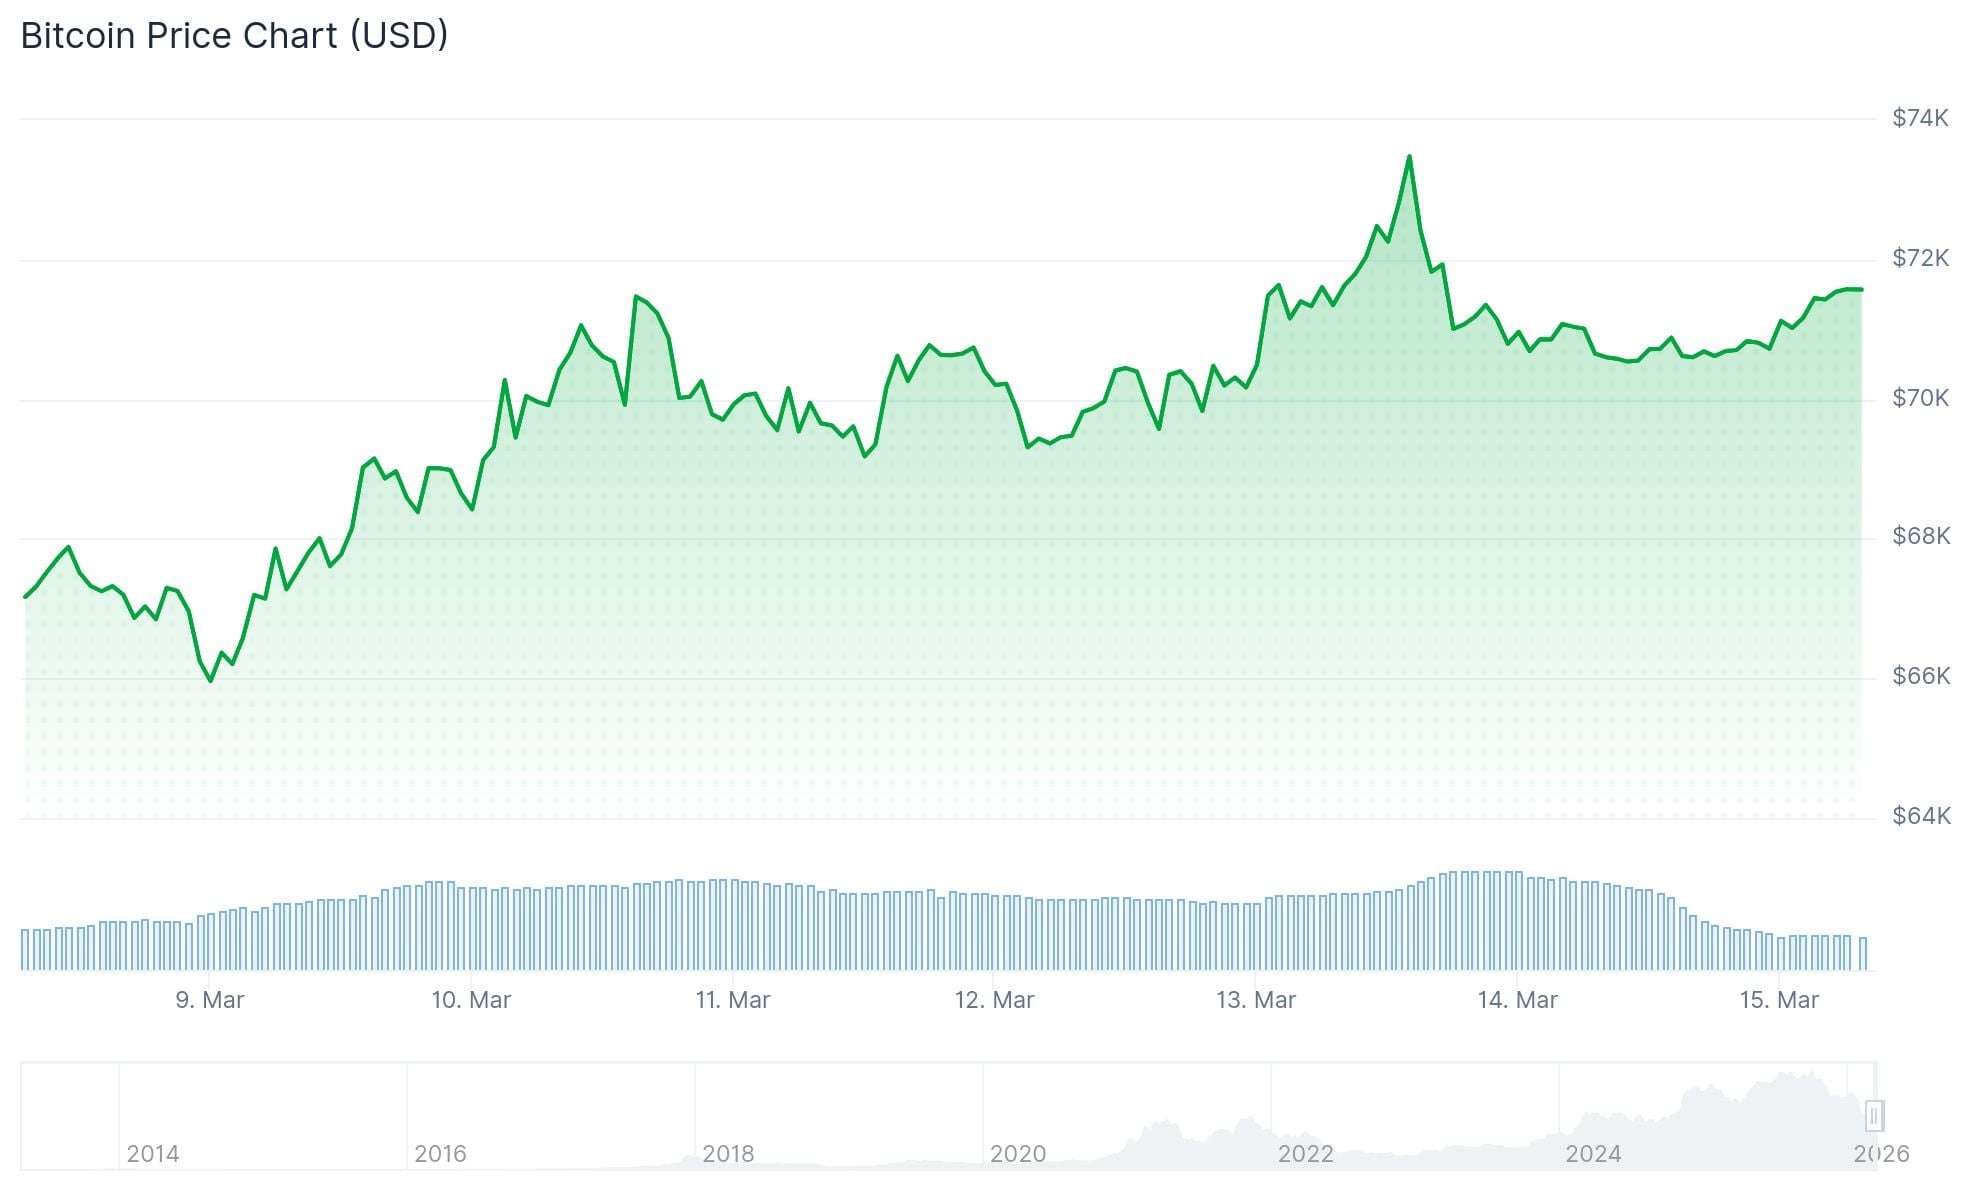
The conflict between the U.S. and Iran commenced on Saturday, February 28. As the sole major trading market active that weekend, Bitcoin immediately reacted with an 8.5% plunge to $64,000, marking its lowest valuation during the initial shock.
Fast forward two weeks, and the narrative has shifted considerably.
From that nadir, Bitcoin has surged approximately 11%, now hovering near $71,500. During this identical period, gold has experienced significant volatility, the S&P 500 has declined, and Asian stock markets endured their most punishing week since 2020. Only crude oil—which skyrocketed over 40%—and the U.S. dollar have delivered stronger returns than Bitcoin. Both assets benefit directly from wartime dynamics.

Higher Support Levels Emerge Following Each Dip
Since February 28, each military escalation has sparked Bitcoin selloffs. However, buyers have consistently intervened at increasingly elevated price points.
Following Iran’s retaliatory missile offensive on March 2, Bitcoin found its floor at $66,000. A week of intensified fighting on March 7 established support at $68,000. When tanker attacks occurred on March 12, BTC maintained $69,400. The Kharg Island strike on March 14 saw the bottom at $70,596.
This pattern reveals ascending support levels rising between $1,000 and $2,000 with each incident.
Simultaneously, Bitcoin has encountered rejection four separate times approaching the $73,000–$74,000 range. This resistance zone remains intact. The standoff suggests an imminent resolution—either Bitcoin breaches $74,000 convincingly, or a more severe escalation overwhelms the buying interest.
Earlier in the year, an abrupt liquidation cascade eliminated $2.5 billion in leveraged trades during one weekend, pushing Bitcoin down to $77,000. That purge seemingly flushed out excessive leverage, creating a more resilient market structure capable of weathering continuous conflict-related news without comparable crashes.
Whale Activity Intensifies, Blockchain Metrics Target $82K
According to intelligence from Santiment, a cryptocurrency analytics firm, large Bitcoin addresses—containing between 10 and 10,000 BTC—have resumed buying near the $71,000 level.
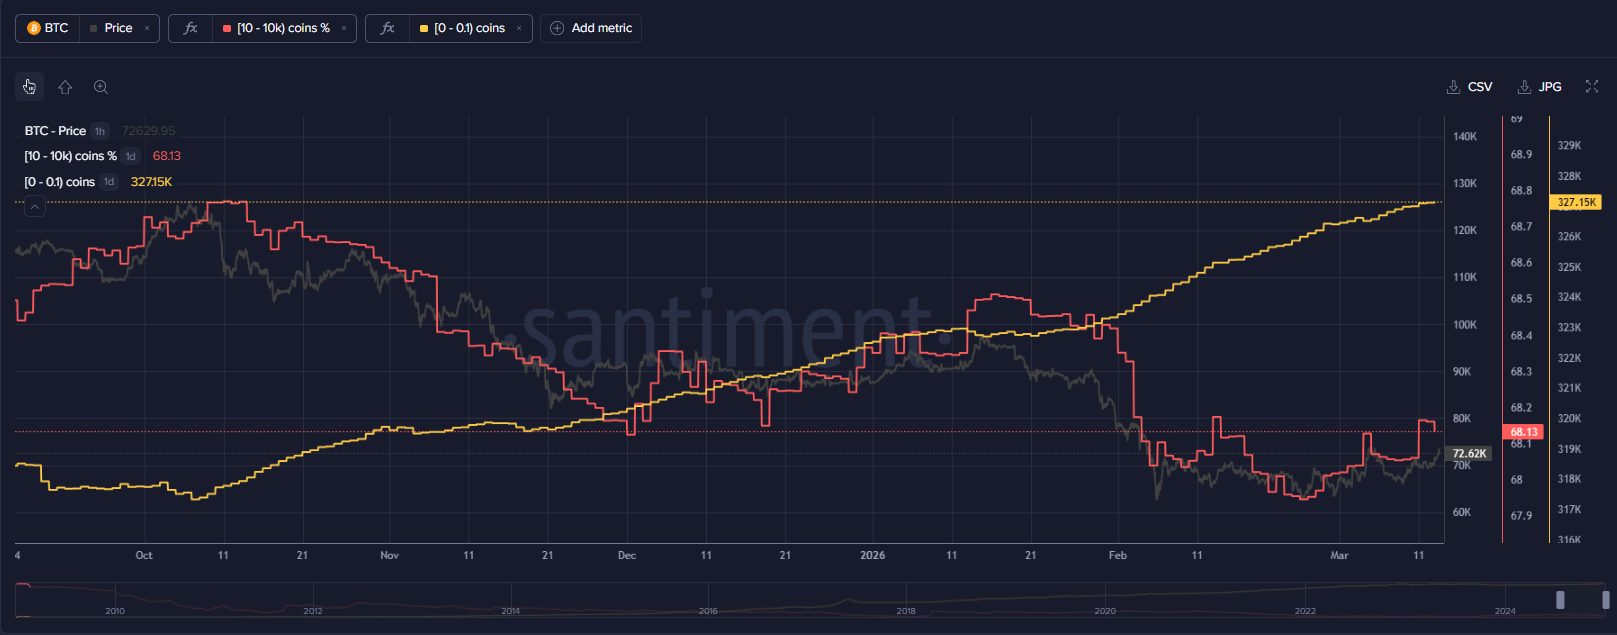
These substantial holders now command 68.17% of Bitcoin’s circulating supply, climbing from 68.07% just seven days prior. Santiment characterized this movement as a “positive reversal.” The firm continues monitoring retail investor behavior, as historical patterns suggest retail capitulation often coincides with market bottoms.
The Crypto Fear & Greed Index registered 16 on Sunday—deep within “Extreme Fear” territory.
U.S. spot Bitcoin ETFs recorded their inaugural five-consecutive-day inflow sequence of 2026 this week, attracting roughly $767 million in fresh capital.
Blockchain analyst Ali Martinez, referencing the UTXO Realized Price Distribution indicator, identified minimal overhead resistance between present levels and approximately $82,045. The $74,000 rejection area, he observed, contains sparse investor cost-basis concentration, implying it may prove less formidable than surface analysis suggests.
The nearest significant downside support resides around $66,898.
Bitcoin has appreciated 7.55% across the previous 30 days. BTC currently trades at $71,500.
Get 3 Free Stock Ebooks
Discover top-performing stocks in AI, Crypto, and Technology with expert analysis.
- Top 10 AI Stocks - Leading AI companies
- Top 10 Crypto Stocks - Blockchain leaders
- Top 10 Tech Stocks - Tech giants

