
 Falls 43% From Peak: AI Predicts Where the Crypto Will Find Support")
Key Takeaways
- Historical Bitcoin bear cycles witnessed declines ranging from 77% to 85%; applying similar metrics to 2025’s $126,198 peak suggests potential lows around $19,000–$29,000.
- Market experts suggest the present downturn resembles an intermediate correction rather than the beginning of a prolonged bear phase.
- Technical analysis identifies the most probable support zone between $58,000 and $68,000, though a steeper drop to $48,000–$58,000 remains possible.
- Historical patterns indicate Bitcoin typically finds its floor approximately 12–13 months following a cycle peak, suggesting an October–November 2026 timeframe — though current technical indicators don’t clearly validate this projection.
- Confirmation signals for a genuine bottom include decisive weekly candle closes, successful resistance recaptures, and upward momentum shifts in weekly RSI readings.
On October 6, 2025, Bitcoin reached its highest recorded price of $126,198, as documented by CoinGlass. The digital asset has subsequently retreated to approximately $71,000, prompting the familiar cyclical debate: are we witnessing a temporary correction or the onset of a protracted downturn?
Previous market cycles offer valuable perspective. Bitcoin experienced an 85% retracement from its 2013 zenith, an 84% decline from its 2017 apex, and a 77% pullback from its 2021 summit. Extrapolating these historical drawdowns from the $126,198 high would theoretically project extreme lows between $19,000 and $29,000.
Yet weekly chart technical analysis indicates this cycle may diverge from historical precedent. The established long-term ascending channel structure remains unbroken. Current price action appears more consistent with a retracement following a rejection near the upper boundary of this formation, rather than a catastrophic breakdown into multi-year bearish territory.
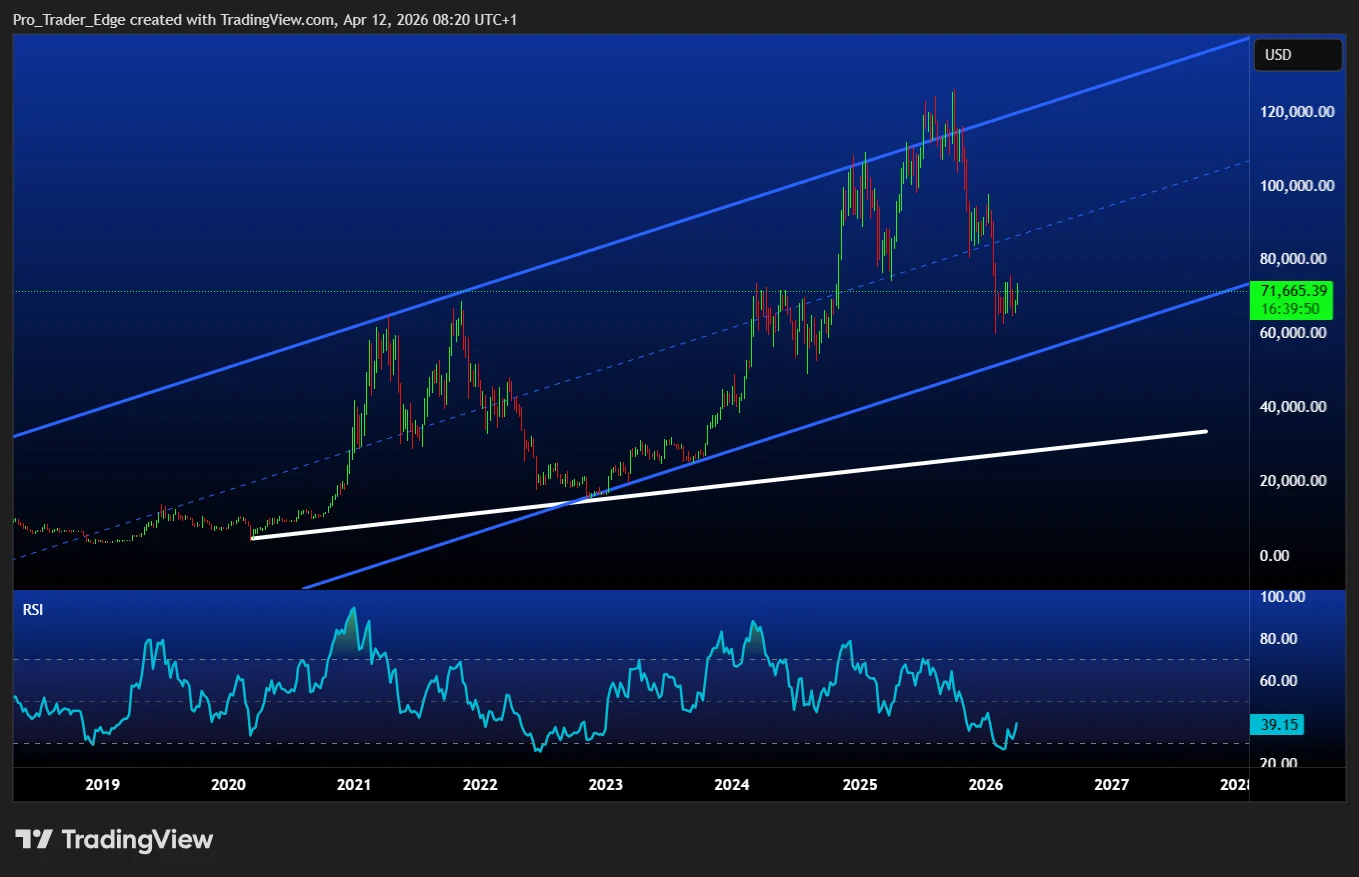
Nevertheless, market analysts maintain that a definitive bottom has not yet formed. Weekly Relative Strength Index readings continue showing weakness, and bullish momentum has not materialized. The market structure appears compromised but hasn’t reached complete capitulation.
Identifying Potential Support Levels
Based on technical chart analysis, the highest probability support region sits between $58,000 and $68,000. This zone would constitute a retracement of approximately 46% to 54% from the October 2025 peak.

A more aggressive selloff pushing Bitcoin into the $48,000 to $58,000 range — representing a 54% to 62% correction — remains within realistic parameters should panic selling intensify. Both scenarios would be substantial but significantly less severe than the 80%-plus collapses witnessed in previous cycles.
An alternative bullish scenario exists as well. Should demand resurge promptly, a relatively shallow bottom formation between $68,000 and $74,000 cannot be dismissed.
Historical cycle analysis shows Bitcoin typically establishes its bear market floor roughly 12 to 13 months following the preceding cycle peak. Applying this framework would position a potential trough near October to November 2026, assuming October 2025 marked the authentic cycle zenith.
Current Technical Picture
However, present chart formations don’t exhibit the classic blow-off top followed by systematic collapse pattern typical of completed cycles. Instead, the structure suggests a significant consolidation phase within an intact higher-timeframe uptrend.
If this interpretation proves accurate, the ultimate bottom may materialize within several weeks to a few months, rather than extending into late 2026.
Technical confirmation signals that would validate a genuine bottom formation include: a decisive weekly candle close above key levels, successful recapture and hold of nearby resistance zones, and a definitive reversal in weekly RSI momentum. None of these confirmatory signals have yet manifested.
While Bitcoin trading at $71,000 offers better value than prices near the all-time high, technical analysts haven’t identified a clear, high-probability floor formation at current levels.
Concluding Assessment
Investors seeking to identify Bitcoin’s bottom should conceptualize support as price ranges rather than precise targets. The optimistic scenario envisions a shallow low around $68,000–$74,000. The baseline expectation centers on $58,000–$68,000. Any breakdown below $48,000 would fundamentally alter the narrative from healthy correction to legitimate bear market territory.
Get 3 Free Stock Ebooks
Discover top-performing stocks in AI, Crypto, and Technology with expert analysis.
- Top 10 AI Stocks - Leading AI companies
- Top 10 Crypto Stocks - Blockchain leaders
- Top 10 Tech Stocks - Tech giants

