
 Price: Analysts Predict One Final Flush Before Next Major Rally")
TLDR
- Bitcoin could decline to $104,000 before the current bull market resumes, according to multiple crypto market analysts
- The 50-week simple moving average at $102,500 has acted as reliable support four times since mid-2023
- High leverage levels and a large liquidity cluster near $104,000 increase the likelihood of this support level being tested
- Historical patterns show Bitcoin reversed strongly after touching this indicator in April 2025 at $74,000 and August 2024 at $49,000
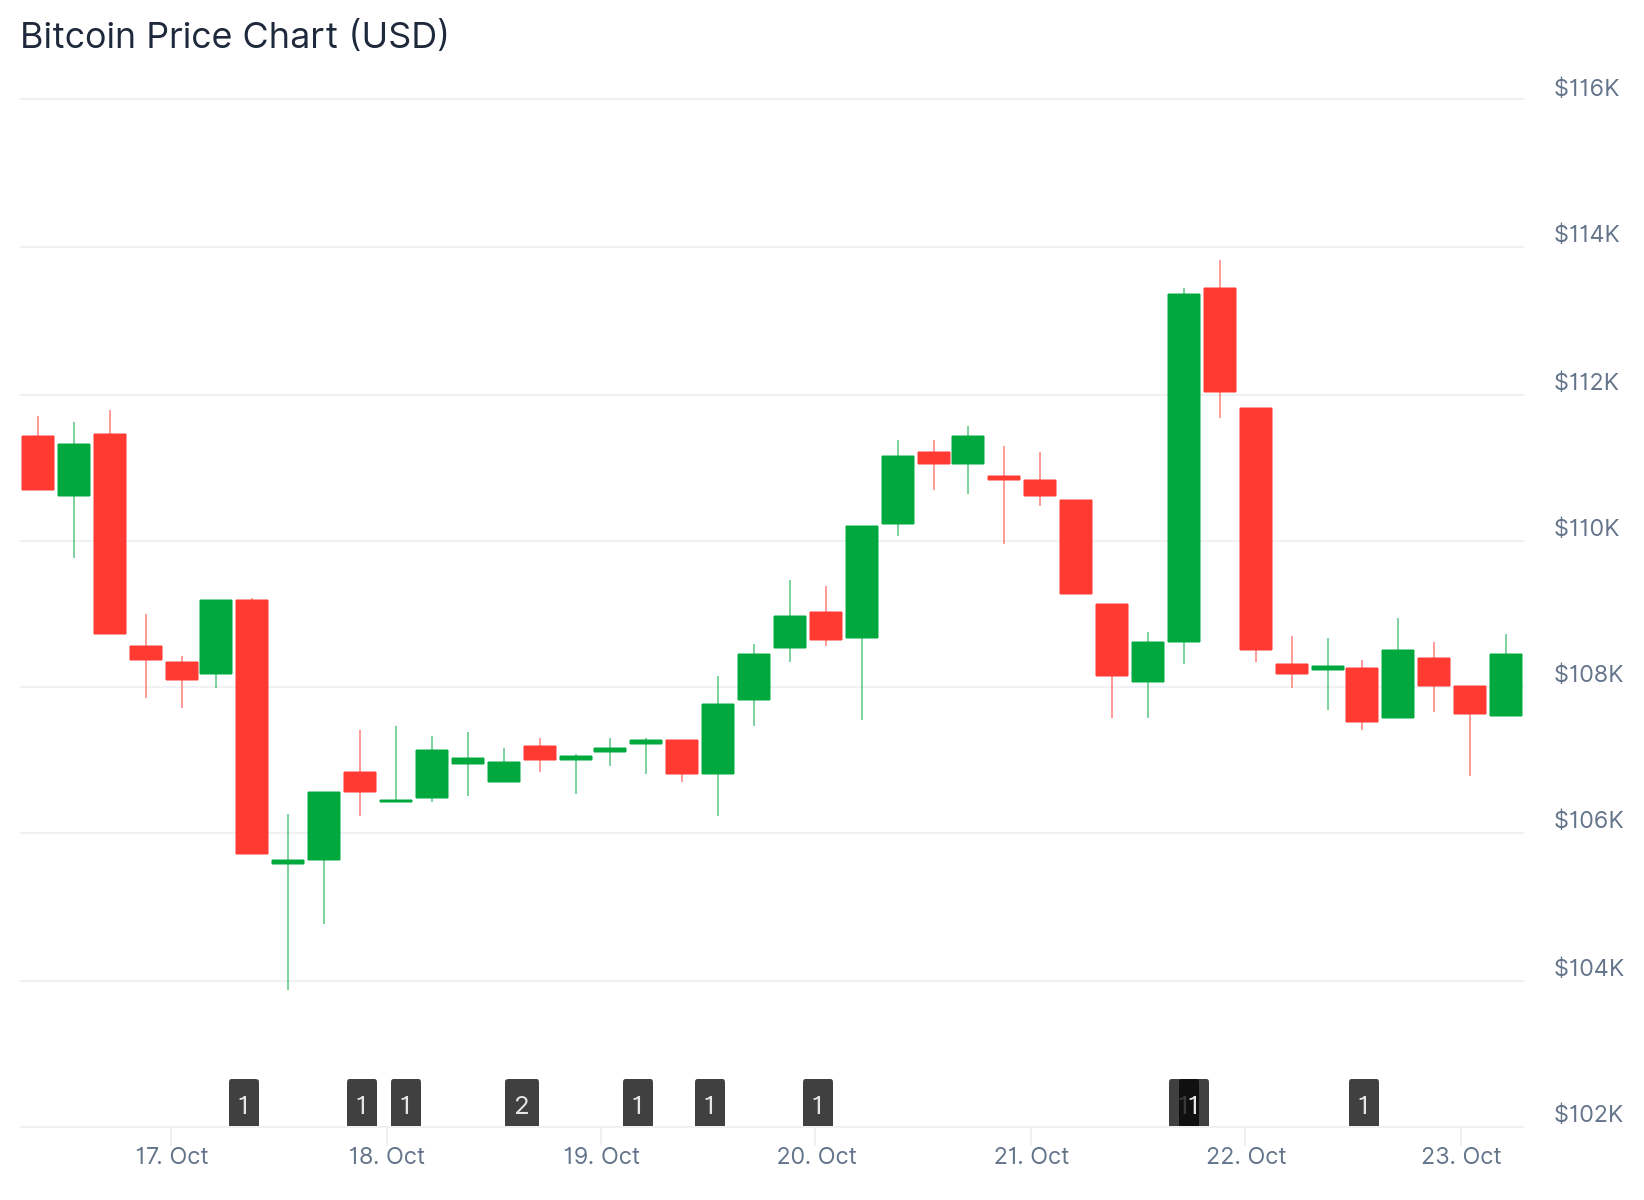
- Bitcoin currently trades around $108,000 after failing to hold above $113,000 earlier this week
Bitcoin faces potential downside pressure as analysts predict one final correction. The cryptocurrency may need to drop to $104,000 before the bull market can properly continue.
Multiple market experts are watching the 50-week simple moving average closely. This key technical indicator currently sits at approximately $102,500. The level has provided strong support four times since the bull market began in mid-2023.
Market analysts expect Bitcoin to revisit this support zone soon. High leverage remains in the market. A large liquidity cluster exists around $104,000.
Analyst Sykodelic explained on Thursday that the market will likely take out this level. “I know its not what any holder wants to hear, but very likely we take that out,” the analyst stated.
Markets typically feel worst right before major reversals occur. This pattern has already appeared twice during the current cycle.
Bitcoin fell to $74,000 in April 2025 when it reached the 50-week simple moving average. In August 2024, the price crashed to $49,000 at the same technical level. Both instances showed extremely negative market sentiment. Both times resulted in strong reversals after touching that support.

Analysts See Final Correction Phase
Analyst Negentropic believes this will mark the final flush. “We are seeing a repeat of the final phases of correction in September, it seems like the profit taking this time around is less intensive,” the analyst noted.
The current market structure suggests a move to $102,000 is possible. Analysts believe a larger reversal is approaching.
Nick Ruck from LVRG Research told Cointelegraph that Bitcoin may retrace to $104,000 as a healthy correction. Profit-taking and macroeconomic factors are driving this movement. Institutional interest remains robust despite short-term weakness.
Analyst Daan Crypto Trades highlighted the 200-day exponential moving average as crucial support throughout this cycle. The price has shown volatility around this level during uncertain periods. However, the trend has never been lost for more than one month.
Current Price Action and Key Levels
Bitcoin has remained stable over the last 24 hours. The cryptocurrency trades near $108,000. This represents a key support-turned-resistance zone.
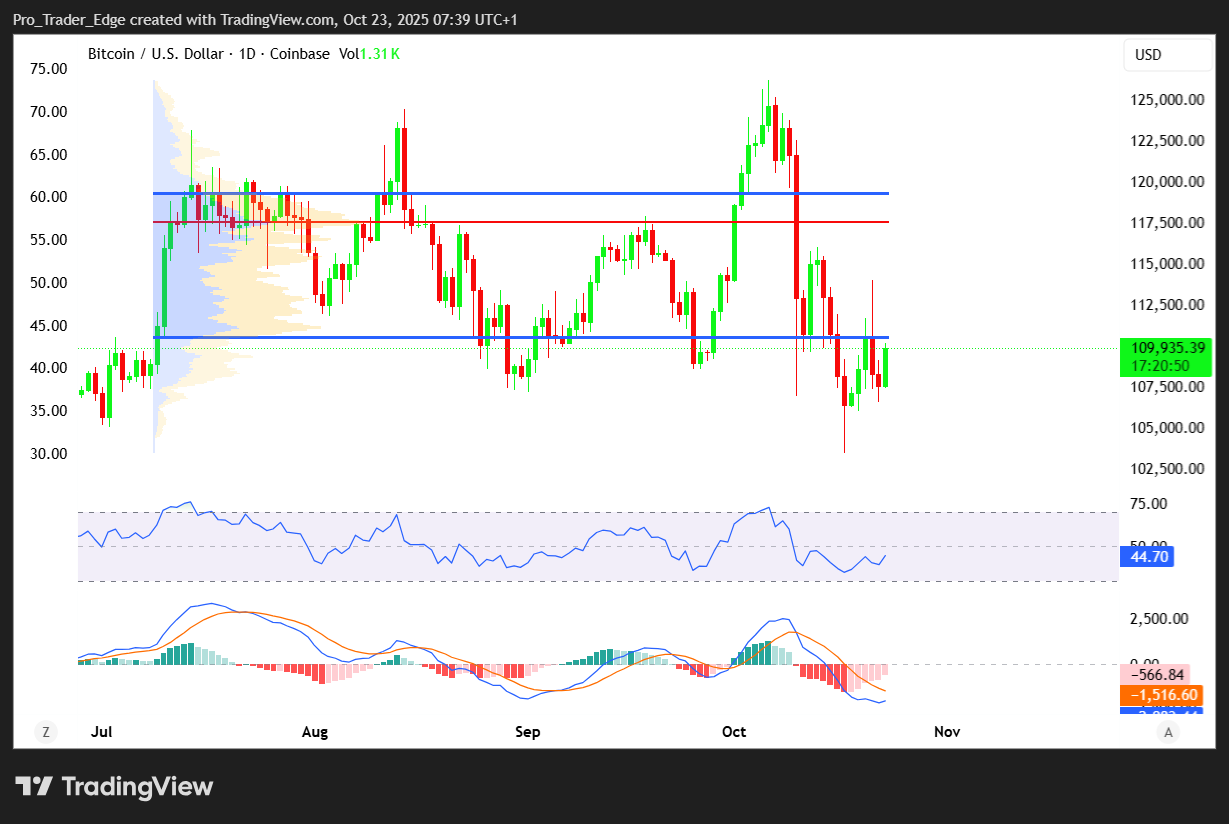
Bitcoin spiked to $113,000 on Tuesday but quickly retreated to $107,000. The price now consolidates at the current resistance level.
The cryptocurrency trades below $109,000 and the 100-hour simple moving average. A short-term declining channel has formed with resistance at $108,800.
Bitcoin recently tested $106,750 and formed a low at $106,717. The price recovered some losses but faces multiple obstacles.
Immediate resistance sits at $108,800. The first key resistance level is $109,500. Additional resistance exists at $110,500. Breaking above these levels could push Bitcoin toward $111,500 and $112,000.
If Bitcoin fails to break $109,500, another decline may occur. Support levels exist at $107,200, $106,750, and $105,800. Further downside could push the price toward $105,000. The main support rests at $103,500.
Get 3 Free Stock Ebooks
Discover top-performing stocks in AI, Crypto, and Technology with expert analysis.
- Top 10 AI Stocks - Leading AI companies
- Top 10 Crypto Stocks - Blockchain leaders
- Top 10 Tech Stocks - Tech giants

