
 Price: Could This Crash Be the Reset Needed to Spark the Next Rally?")
TLDR
- Bitcoin flash crash on August 24th triggered 18% long liquidation dominance, clearing overleveraged retail positions from the market
- New investors face 3.5% unrealized losses while seasoned holders aged 1-6 months maintain 4.5% average profits
- Critical support zone between $100,000-$107,000 aligns with technical indicators and short-term holder cost basis levels
- Market liquidated 94% of traders over three months during bidirectional liquidity hunts targeting high-leverage positions
- $108,800 level serves as key bull-bear divider that could trigger deeper correction to $92,000-$93,000 range
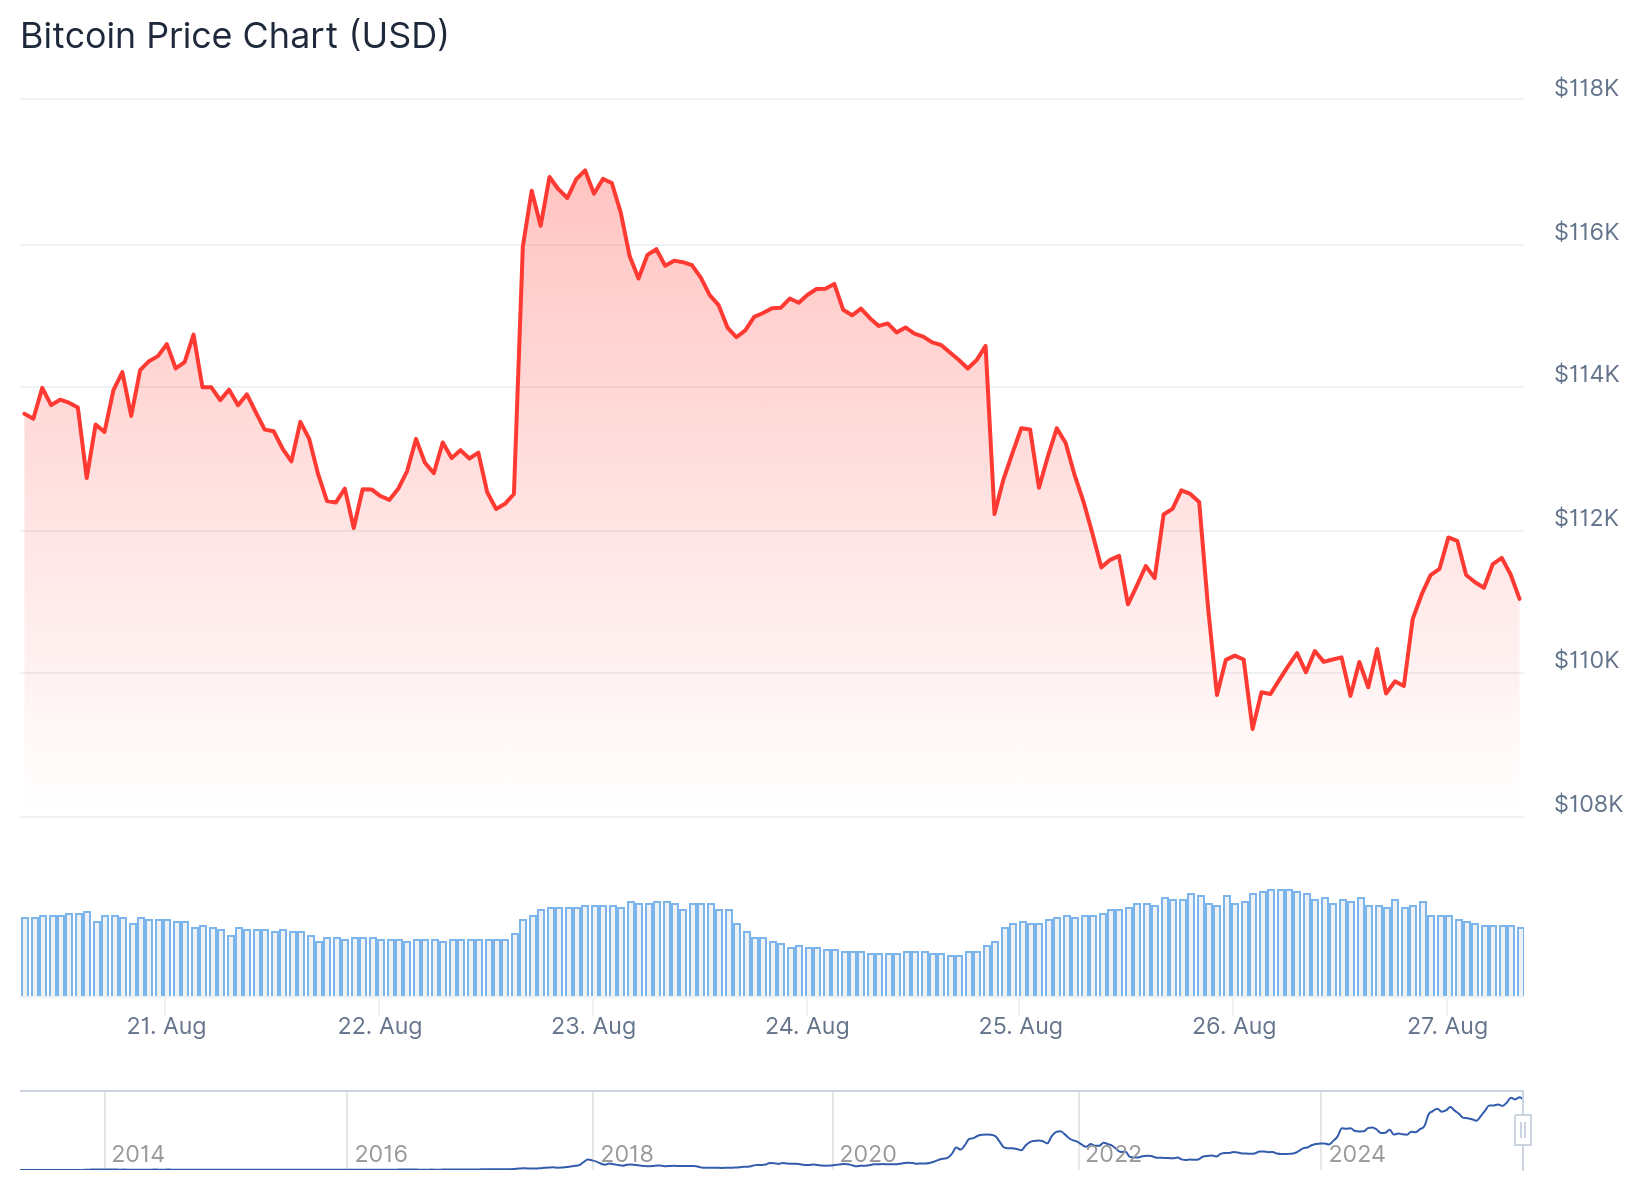
Bitcoin’s recent price action has separated seasoned investors from newcomers. The cryptocurrency trades near $110,000 following a sharp correction that cleared out speculative positions.
The August 24th selloff created the largest long liquidation event in months. Data shows 18% long liquidation dominance, indicating overleveraged positions were wiped from the market.
This type of aggressive deleveraging often helps reset market conditions. With speculative excess reduced, Bitcoin may establish stronger support levels going forward.
On-chain metrics reveal newer investors bore the brunt of recent losses. Holders with coins aged less than one month now face average unrealized losses of 3.5%.

Many short-term holders have already capitulated and sold their positions. This selling pressure drove clear supply reduction from the newest investor cohort.
Veteran Holders Maintain Confidence
Longer-term investors showed different behavior during the correction. The broader short-term holder group aged one to six months remained profitable with 4.5% average gains.

Their resilience suggests only speculative “tourist” buyers were flushed out. More committed investors held their positions through the volatility.

This transfer of coins from weak hands to stronger holders typically reduces future selling pressure. Lower overhead supply often leads to more stable price action.
The liquidation data tells a broader story about current market dynamics. Over the past three months, 94% of traders faced position liquidations.
Bidirectional liquidity hunts have dominated trading activity. Both long and short positions using low to medium leverage were systematically cleared.
When applying liquidity threshold filters, only dense order clusters remain visible. This pattern indicates coordinated efforts to clear large position concentrations.
Technical Levels Define Next Move
Analysts identified critical support between $100,000 and $107,000. This zone aligns with the Short-Term Holder Realized Price and 200-day moving average.
The intersection of these technical levels strengthens the support zone’s reliability. Many experts expect deeper correction to $92,000-$93,000 if this area breaks.
Liquidation heatmaps show massive long clusters formed around $104,000-$107,000. This concentrated liquidity matches the identified support range.
The $108,800 level serves as a crucial short-term threshold. This price represents the average cost basis for recent investors.
Stable closes above $108,800 would signal reduced selling pressure from short-term holders. Breaking below this level could trigger additional selling waves.
Current price action sits about 13% below recent peaks. Technical analysis suggests 10-15% additional downside remains possible if key support fails.
Bitcoin’s spot trading activity has turned sell-dominant, highlighting weakening buy-side demand. This shift increases downside risk toward the $107,557 support area.
Get 3 Free Stock Ebooks
Discover top-performing stocks in AI, Crypto, and Technology with expert analysis.
- Top 10 AI Stocks - Leading AI companies
- Top 10 Crypto Stocks - Blockchain leaders
- Top 10 Tech Stocks - Tech giants

