
 Price Prediction: September Pullback Could Signal October Rally")
TLDR
- Bitcoin averages -3.77% losses in September, historically its worst month
- Fed rate cut probability at 97.6% for September 16-17 meeting
- ETF inflows and institutional adoption provide new support levels
- October “Uptober” pattern shows six consecutive years of gains
- Current trading range between $109,000-$112,000 key for direction
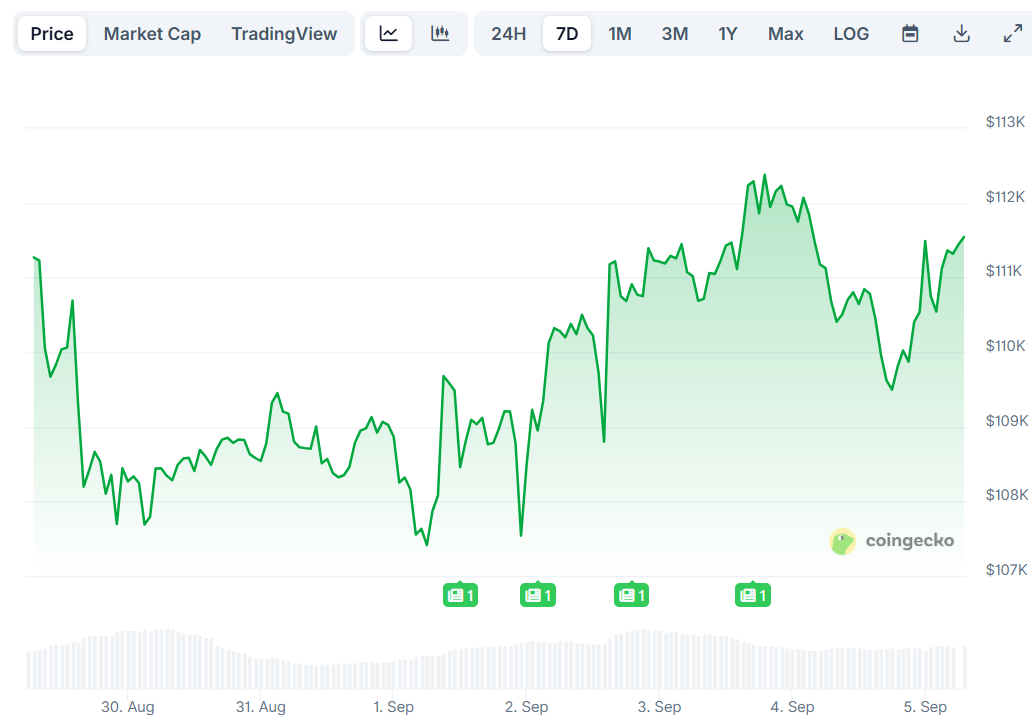
Bitcoin price continues following its historical September pattern, dropping from August highs of $124,000 to current levels around $109,000. This seasonal weakness has become predictable for cryptocurrency traders.
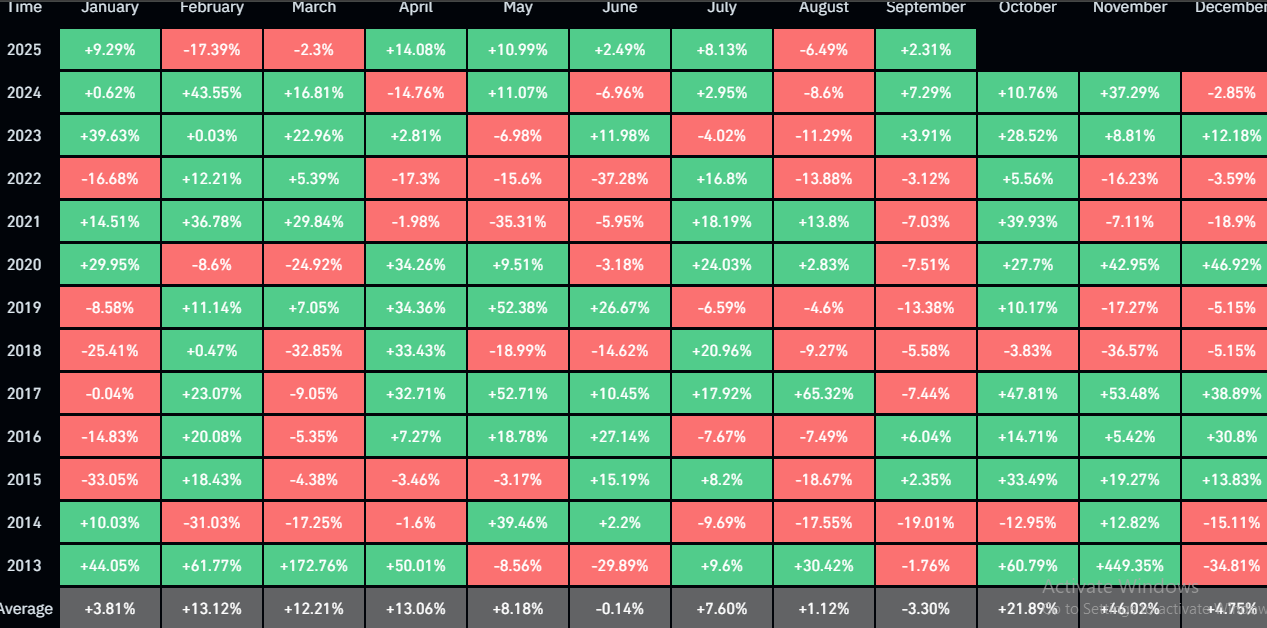
Since 2013, Bitcoin has closed lower in eight of 12 Septembers. The average monthly return of -3.77% makes September Bitcoin’s weakest performing month by far.
Current market conditions mirror traditional patterns but with new variables. Wednesday’s rally to $112,600 quickly reversed during Asian trading sessions as sellers emerged at resistance levels.
The Federal Reserve meeting on September 16-17 dominates trader focus. CME Group’s FedWatch tool shows 97.6% probability of a 25 basis point rate cut, potentially boosting risk assets like Bitcoin.
Recent ADP payroll data disappointed with only 54,000 jobs added versus 75,000 expected. Friday’s official jobs report could determine Fed policy direction and Bitcoin’s next move.
Institutional Factors Change Market Dynamics
Spot Bitcoin ETFs launched in January 2024 have transformed market structure. These funds trade billions daily and accumulated substantial positions throughout 2025, providing price support during weak periods.

Corporate treasury adoption has accelerated this year. Public companies continue adding Bitcoin to balance sheets, creating additional demand channels that didn’t exist during previous September selloffs.
Data from Hyblock shows both retail and institutional buyers accumulating during recent dips. This buying pressure suggests underlying demand remains strong despite seasonal headwinds.

The current liquidation heatmap reveals tight trading between $109,000 and $112,000. Short-term traders take profits near range highs while longer-term investors buy weakness.
Labor market data shows 7.24 million unemployed Americans versus 7.18 million job openings. This employment shift supports Fed dovish policy expectations.
Bitcoin Price Prediction
Historical patterns suggest current weakness may reverse in October. Bitcoin has gained in October six consecutive years, earning the “Uptober” nickname among traders.
October ranks as Bitcoin’s second-strongest month after November. Past cycles show September losses frequently recovered during October rallies.
Key resistance sits at $112,000 where sellers previously emerged. A daily close above this level could signal the end of September weakness and start of autumn strength.
Support levels hold around $109,000 based on recent buying activity. Breaking below could target the $105,000-$107,000 zone where institutional buyers may emerge.
Fed rate cuts typically benefit Bitcoin by reducing opportunity costs versus yield-bearing assets. A September cut could catalyze the traditional October rally pattern.
ETF demand and corporate adoption provide structural support absent in previous cycles. These factors may limit downside risk while amplifying any October recovery.
The combination of seasonal patterns, Fed policy, and institutional flows suggests Bitcoin could see renewed strength entering the fourth quarter.
Get 3 Free Stock Ebooks
Discover top-performing stocks in AI, Crypto, and Technology with expert analysis.
- Top 10 AI Stocks - Leading AI companies
- Top 10 Crypto Stocks - Blockchain leaders
- Top 10 Tech Stocks - Tech giants

