
 Price Prediction: Technical Breakdown Signals Potential Drop to $107K")
TLDR
- Bitcoin broke below key 50-day and 100-day moving averages for first time since April
- Record $1.62 billion long liquidations occurred Monday, largest single-day event this year
- Social media “buy the dip” sentiment hits monthly high, creating contrarian signal
- Liquidity analysis shows deepest cluster at $107,000 acting as potential price magnet
- Whale and retail accumulation continues despite ongoing selling pressure
Bitcoin has experienced its most challenging trading week in months as the leading cryptocurrency broke through critical technical support levels that had held firm since April.
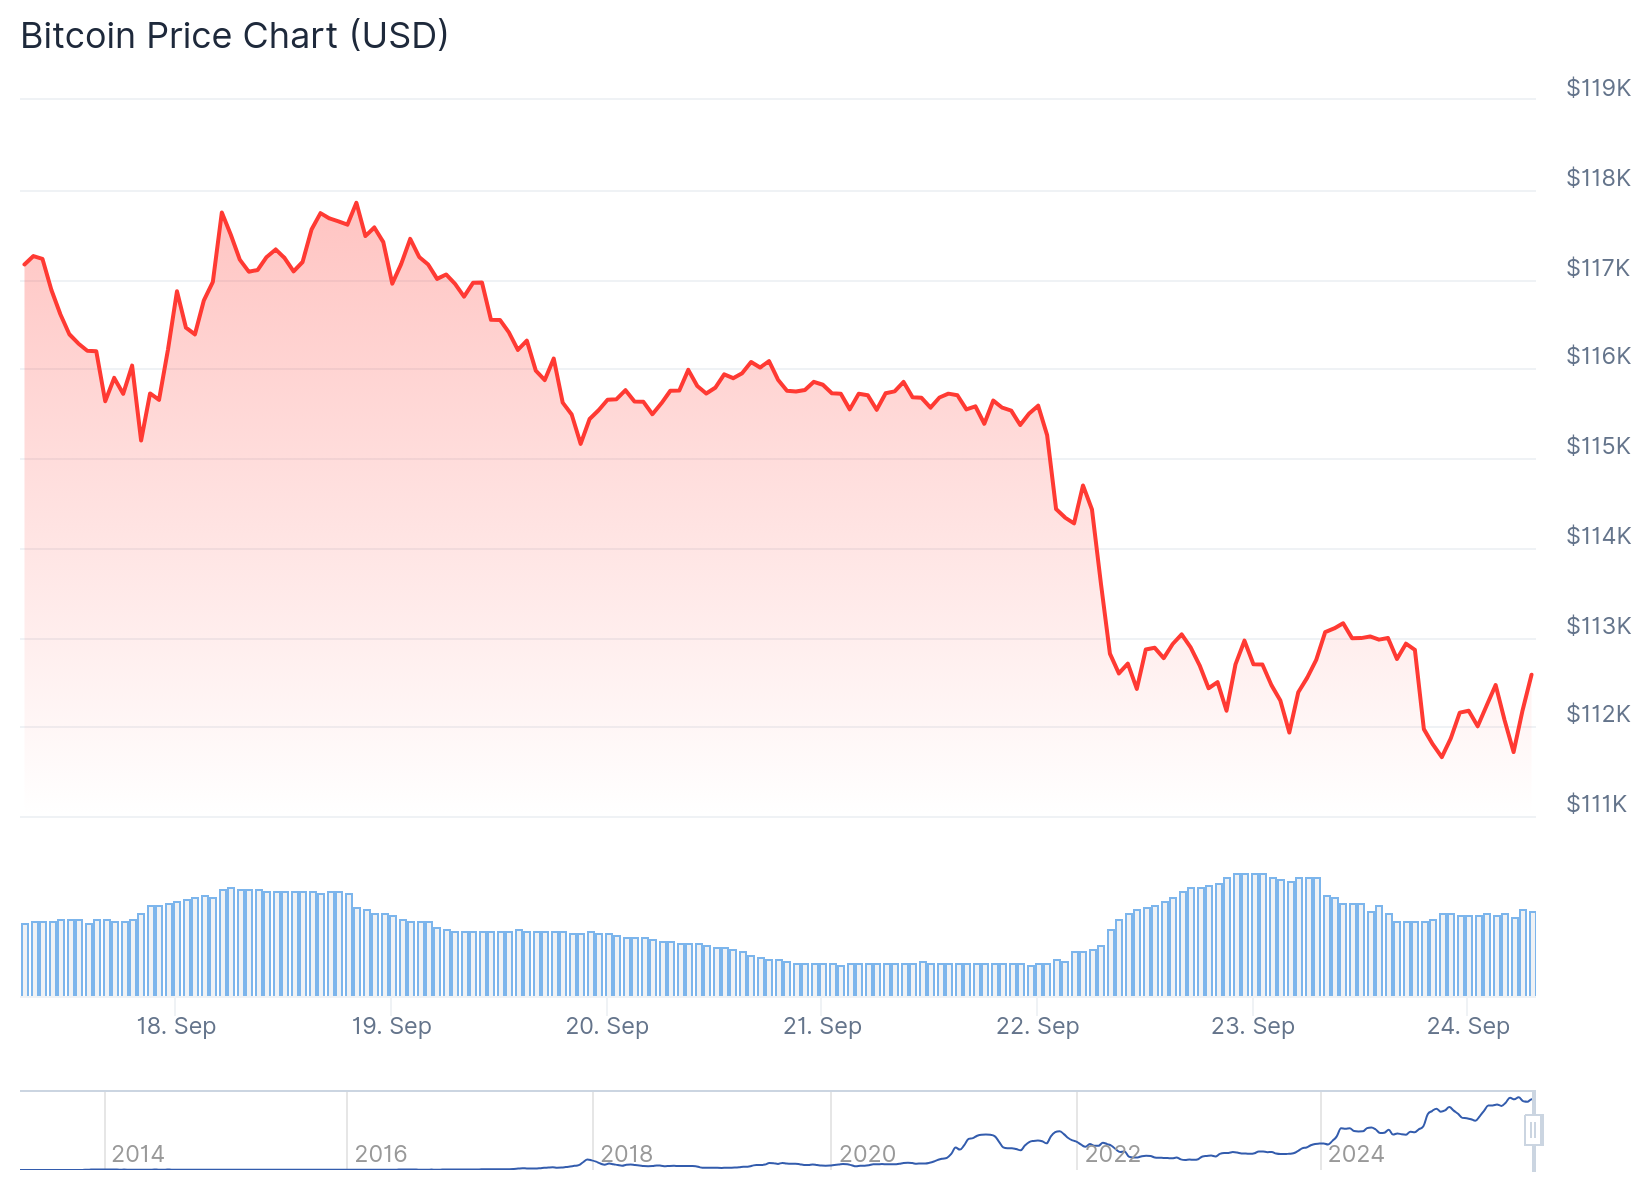
The digital asset declined over 3% this week to $111,590, piercing both the widely-watched 50-day and 100-day simple moving averages. These technical indicators have lost their upward trajectory for the first time since April, now moving sideways in a pattern that typically signals caution for bullish traders.
Monday delivered a harsh reminder of market volatility when Bitcoin experienced its largest single-day long position liquidation event of 2025. A staggering $1.62 billion in leveraged long positions were forcibly closed, highlighting the excessive leverage that had accumulated in the derivatives market.
Despite the sharp selloff, on-chain data reveals that both retail investors and large-scale holders have been actively accumulating during the price decline. Binance’s True Retail Longs and Shorts Account data shows increased leveraged long positions since Monday’s liquidation event, suggesting continued buying interest at current levels.
Social Sentiment Creates Contrarian Signal
Social media platforms have witnessed a surge in “buy the dip” discussions, with mentions reaching their highest level in nearly a month according to Santiment data. The analytics platform tracks these conversations across Reddit, Telegram, and X to gauge retail investor sentiment.
This spike in optimistic social media chatter is interpreted as a contrarian indicator by market analysts. Historical patterns suggest that when retail sentiment becomes overly bullish during price declines, further downside movement often follows.

Santiment’s analysis indicates that prices frequently move opposite to crowd expectations. The platform suggests that additional selling pressure may emerge before a sustainable bottom forms, particularly as retail investors maintain optimistic outlooks near current price levels.
Technical Analysis Points to Lower Targets
Order book liquidity analysis conducted by Hyblock Capital reveals the deepest concentration of trading interest at the $107,000 level. This liquidity cluster can function as a price magnet, potentially drawing Bitcoin lower from current trading ranges.
Additional liquidity pools have formed at $109,000 and $111,000, representing areas where traders have positioned buy and sell orders. These levels may provide temporary support during any continued decline.
Aggregate cumulative volume delta data demonstrates that selling pressure continues to dominate market structure. This technical indicator suggests elevated probability for deeper retracements toward established range lows.
Bitcoin’s liquidation heatmaps show the cryptocurrency moving through underlying bid liquidity, with substantial liquidation risk concentrated around the $107,000 to $106,000 zone. This area represents a critical support region where leveraged positions face potential forced selling.
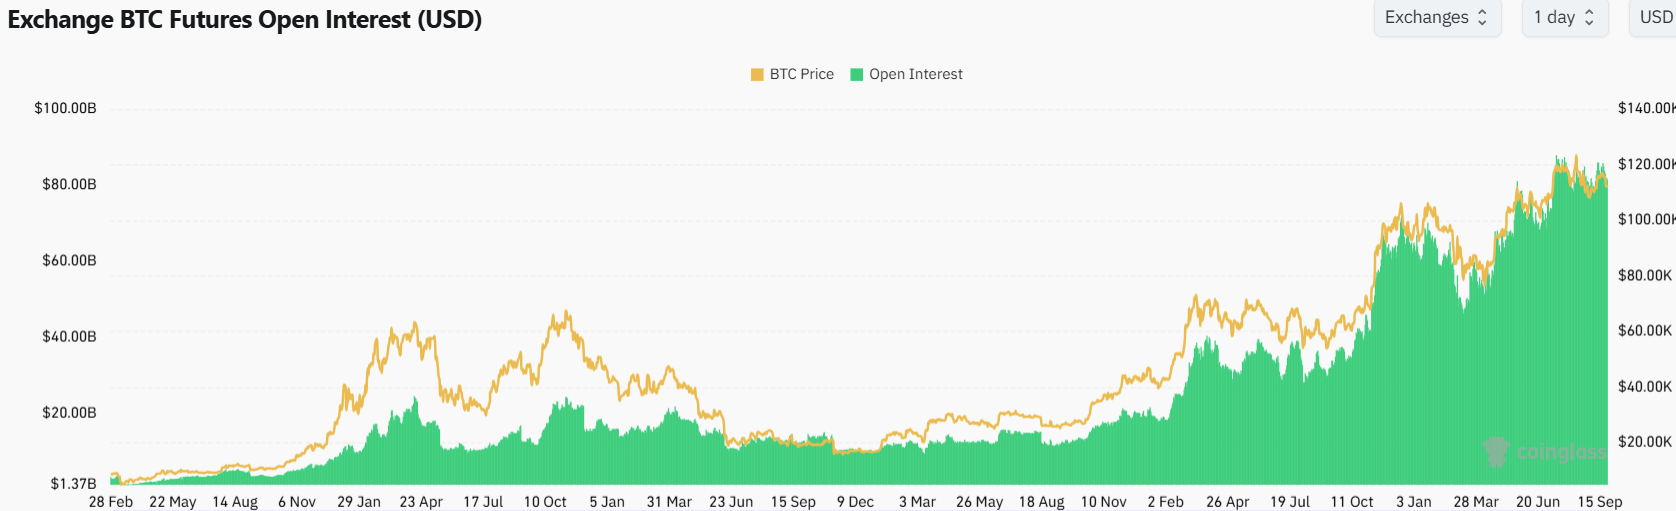
Open interest in Bitcoin futures has maintained a range between $46 billion and $53 billion since late July. However, both spot market volumes and aggressive perpetual futures positioning remain subdued, limiting the potential for strong trend reversals.
Bitcoin Price Prediction
Current market structure suggests Bitcoin faces continued downside pressure despite accumulation from larger holders. The combination of broken technical support, contrarian social sentiment, and concentrated liquidity at lower levels points toward a potential test of the $107,000 region.
Bitcoin currently trades around $112,495 as market participants monitor key support zones at $107,000 and $106,000 for signs of stabilization or further decline.
Get 3 Free Stock Ebooks
Discover top-performing stocks in AI, Crypto, and Technology with expert analysis.
- Top 10 AI Stocks - Leading AI companies
- Top 10 Crypto Stocks - Blockchain leaders
- Top 10 Tech Stocks - Tech giants

