
 Price: Why Analysts See 75% Chance of Retesting October Lows This Week")
TLDR
- Bitcoin dropped 3.54% to $111,800 after failing to break through the $115,300-$117,000 resistance zone on October 13
- Alphractal CEO estimates 60-75% probability Bitcoin retests October 10 lows this week, potentially triggering fresh declines
- Binance recorded $590 million in USDT inflows via TRON network while derivatives exchanges saw increased Ethereum-based stablecoin activity
- Technical indicators show bearish momentum with MACD in negative territory and RSI below 50 level
- Major support levels sit at $111,800 and $110,500, with potential downside targets at $108,500 and $107,000
Bitcoin surged to $115,963 on October 13, posting a 5.84% gain from the prior day’s low of $109,500. The rally lost steam at the critical $115,300-$117,000 resistance zone.
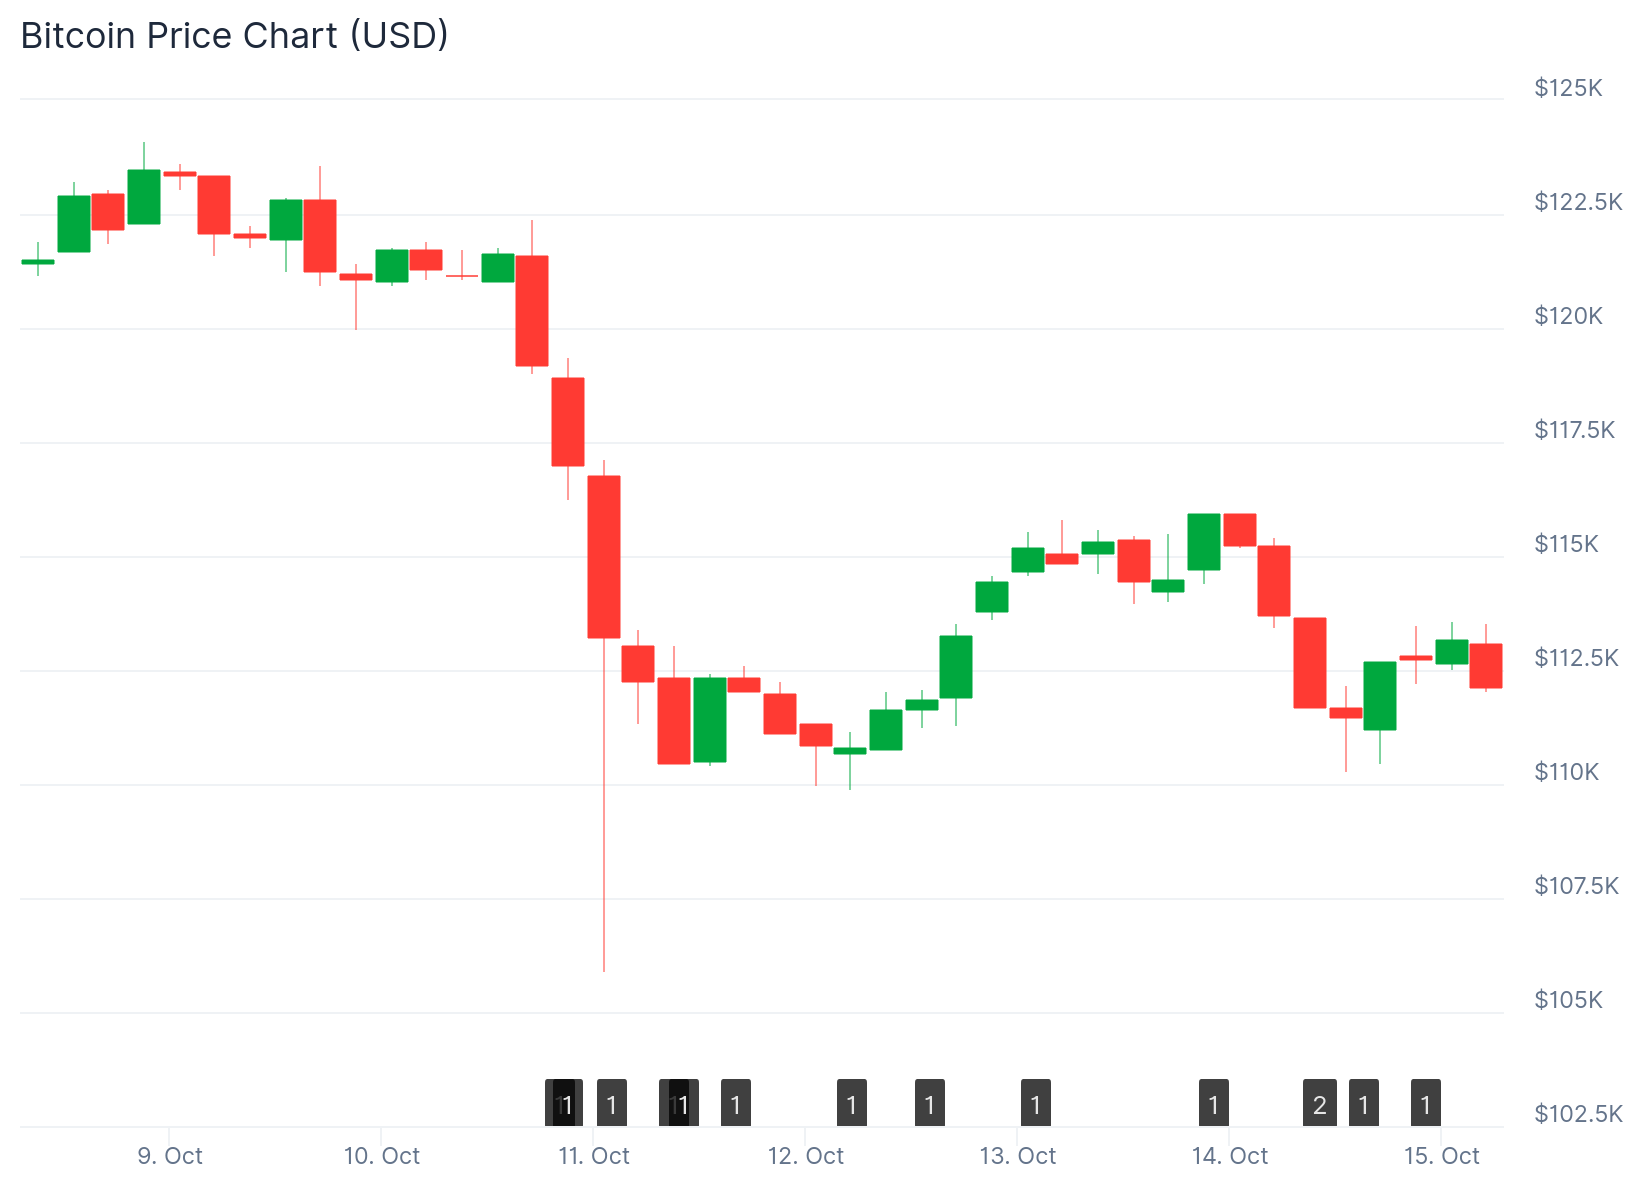
Sellers pushed Bitcoin down 3.54% to $111,800. The price now trades below the $115,000 mark and the 100-hour simple moving average.
A bearish trend line has formed with resistance at $118,250. The short-term outlook remains negative unless buyers reclaim $117,000 as support.
$590 Million Stablecoin Inflows Point to Volatility
Binance received $590 million in Tether inflows through the TRON network over recent days. These inflows coincided with Bitcoin’s push above $115,000.

Whale wallets holding over $100 million showed increased activity during this period. Analysts say this pattern raises the probability of sharp price swings.
Derivatives exchanges captured most of the Ethereum-based stablecoin inflows. This indicates traders are opening leveraged long positions to buy the dip.

The leverage buildup creates risk. Another downward move could liquidate these positions and accelerate selling pressure.
Joao Wedson, CEO of Alphractal, estimates a 60-75% chance Bitcoin retests its October 10 lows. This potential retest could happen this week and catch bullish traders off guard.
Key Price Levels and Technical Outlook
Immediate resistance sits at $114,000. The first major resistance level is $115,000.
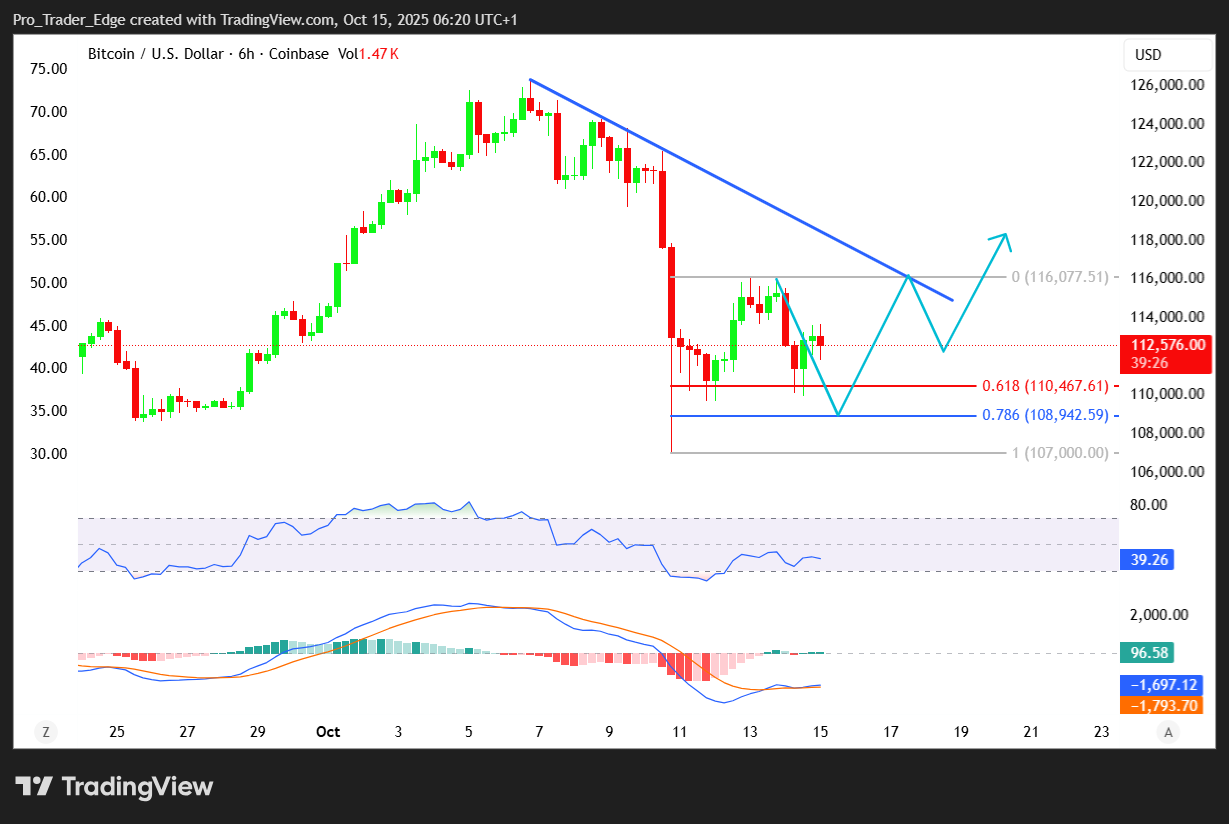
A break above $116,000 would open the path to $117,200. This corresponds to the 76.4% Fibonacci retracement from the $122,498 high to the $100,000 low.
Support levels begin at $111,800. The first major support is $110,500.
Additional support exists at $110,200. A break below this level targets $108,500 in the near term.
The main support zone sits at $107,000. Bitcoin may struggle to recover if it drops below this level.
The hourly MACD indicator is gaining momentum in bearish territory. The Relative Strength Index has fallen below 50.
Market Sentiment and Trading Strategy
Traders should prepare for additional downside moves. A shift to bullish sentiment requires a close above $116,000.
The price climbed above the 61.8% Fibonacci retracement level before facing selling pressure. Bulls pushed above $115,000 but encountered multiple hurdles.
A successful break of $116,000 resistance could drive prices toward $117,250. Further gains might test the $118,500 level.
Failure to reclaim $116,000 opens the door for continued declines. The $110,500 support level becomes critical in this scenario.
Only 10% of altcoins on Binance trade above their 200-day moving average. Many altcoins experienced 40-70% declines on October 10.
Bitcoin recovered above $112,000, $112,500, and $113,200 before stalling. The recovery attempt failed to generate enough momentum to break key resistance levels.
Get 3 Free Stock Ebooks
Discover top-performing stocks in AI, Crypto, and Technology with expert analysis.
- Top 10 AI Stocks - Leading AI companies
- Top 10 Crypto Stocks - Blockchain leaders
- Top 10 Tech Stocks - Tech giants

