

TLDR
- Crypto analyst Cryptobirb says Bitcoin bull market is 93% complete with 60 days remaining
- Current cycle started after April 2024 halving and has lasted 1,007 days so far
- Historical patterns suggest peak between October 19 – November 20, 2025
- Previous bear markets saw average 66% corrections lasting 364-411 days
- Technical support sits at $97,094 with resistance at $117,058
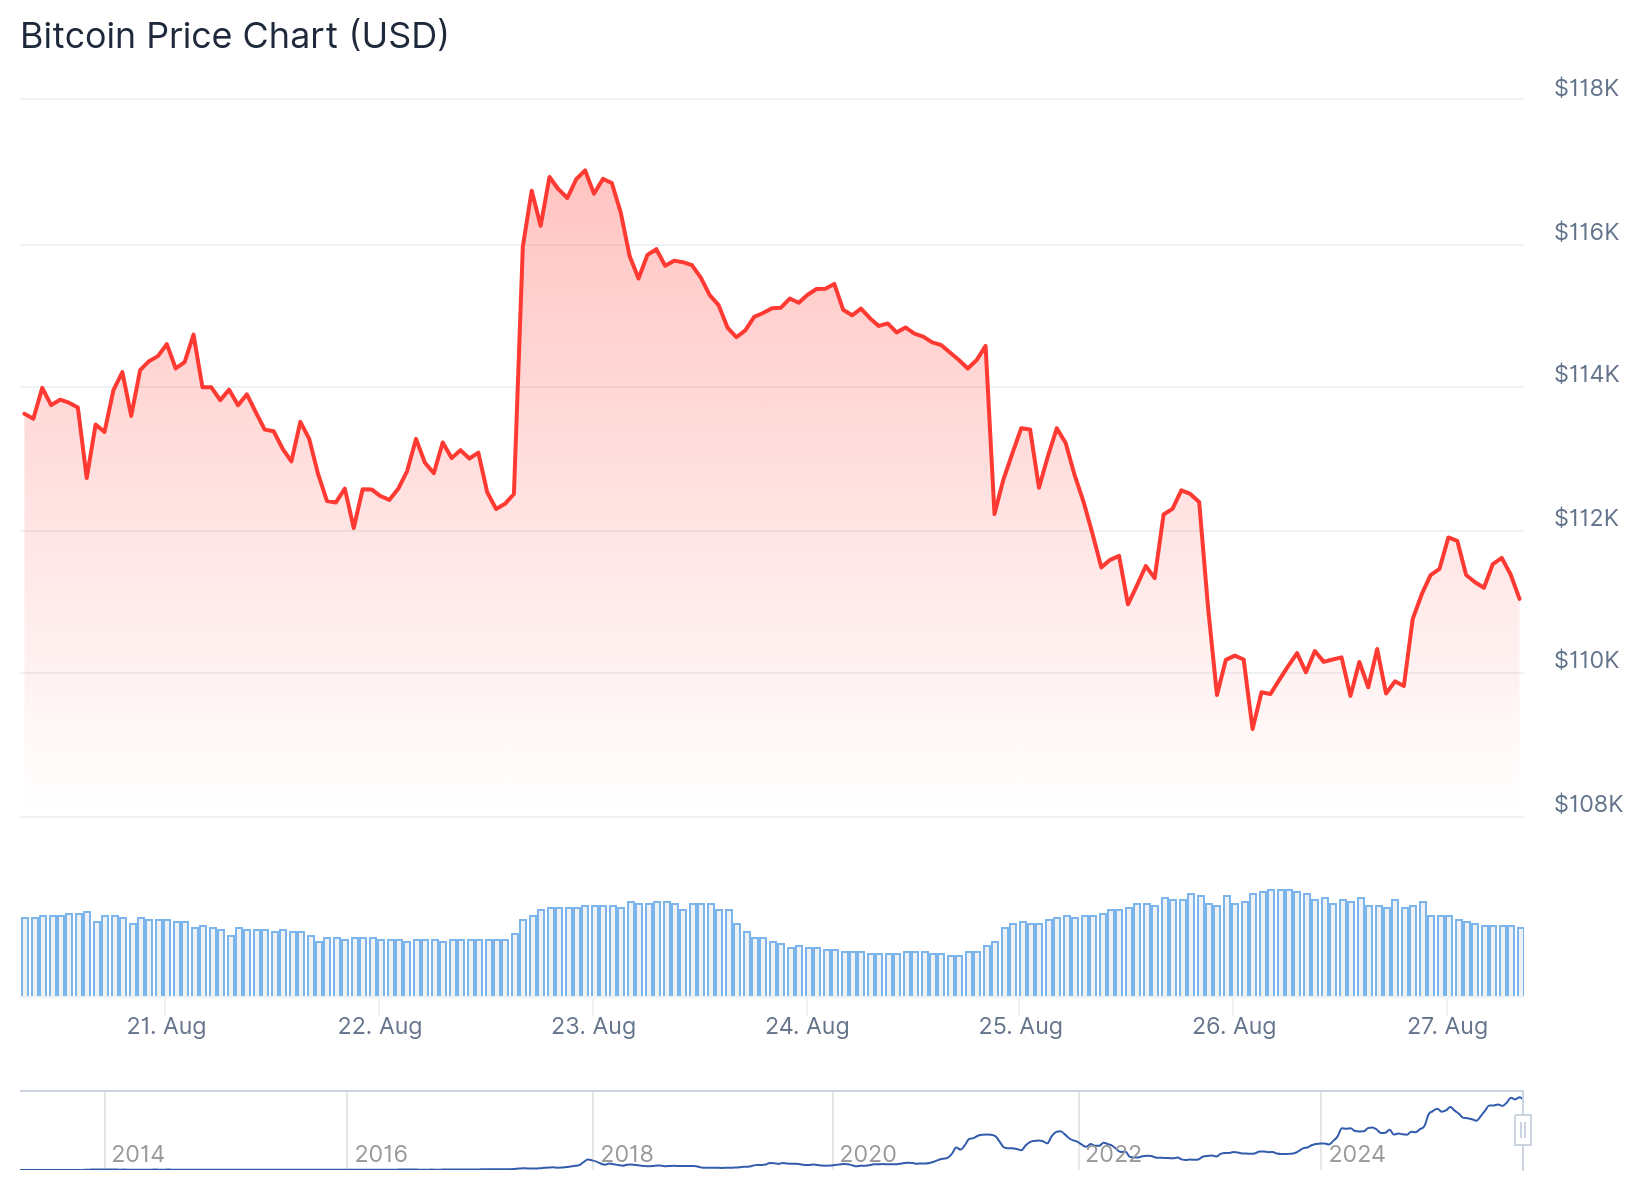
Bitcoin’s current bull market may be entering its final stretch according to prominent crypto analyst Cryptobirb. The assessment comes as Bitcoin retreated from its recent all-time high above $124,000 to trade below $110,000.
The analyst’s research suggests Bitcoin is 93% through its current bull cycle. This cycle began following the April 19, 2024 halving event and has lasted 1,007 days to date.
Historical data supports this timeline projection. Previous Bitcoin bull runs lasted varying durations: 350 days (2010-2011), 746 days (2011-2013), 1,068 days (2015-2017), and 1,061 days (2018-2021).
Halving Patterns Support October Timeline
The current cycle appears on track to reach 1,060 to 1,100 days total. This timeline places the projected peak between late October and mid-November 2025.
Bitcoin halving events provide additional evidence for this prediction. Historical data shows previous halvings led to price peaks approximately 492 days later on average.
Using the April 2024 halving as a reference point, this suggests a target window from October 19 to November 20, 2025. The calculation aligns with Cryptobirb’s 60-day projection from the current date.

Past bear markets following cycle peaks have typically lasted 364 to 411 days. These downturns produced average losses around 66% from peak prices.
If this pattern repeats, Bitcoin could potentially retrace toward $37,000 during the next bearish phase. Based on historical timing, any major bear market may not begin until 2026.
Technical Analysis and Market Conditions
Current technical indicators show Bitcoin maintaining position above key support levels. Weekly chart analysis reveals mean-based support at $97,094 and resistance at $117,058.
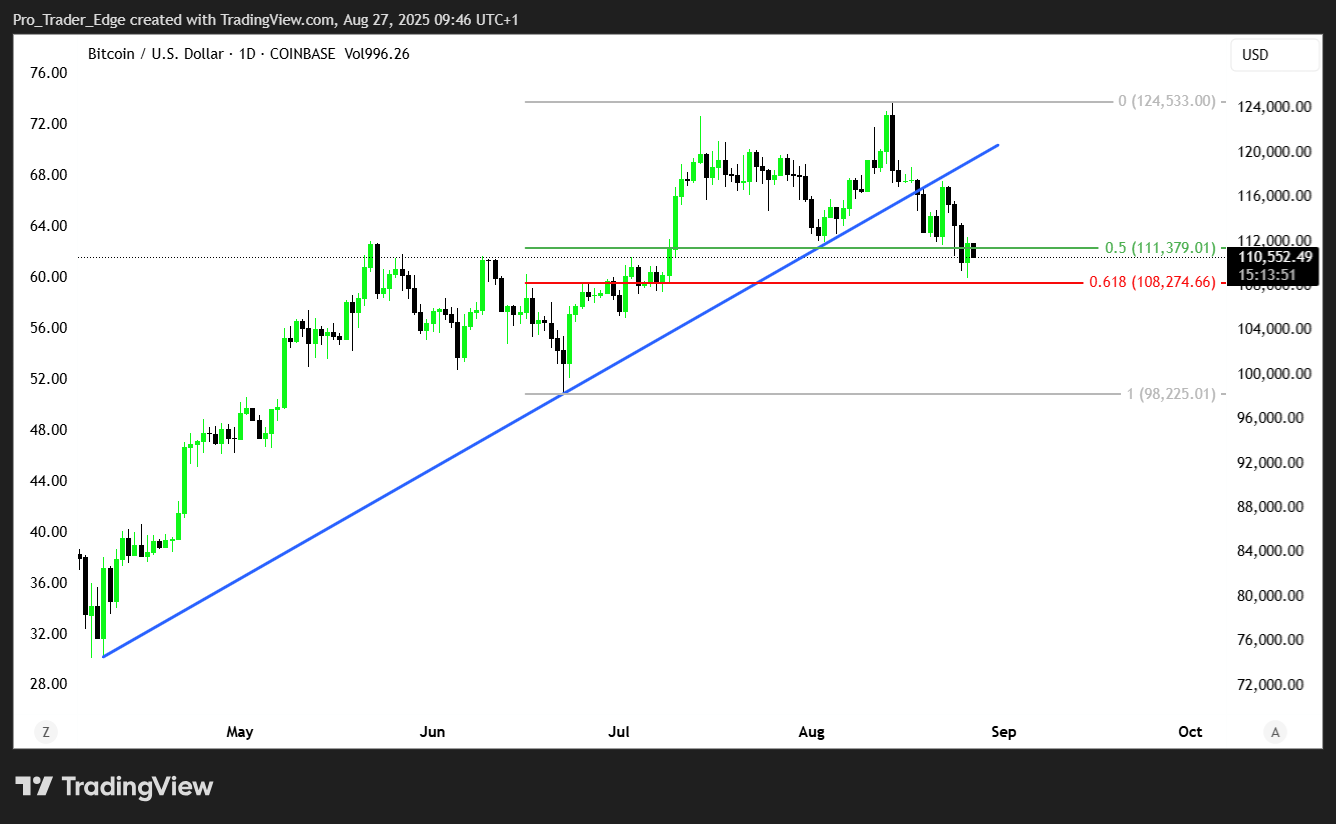
Bitcoin is currently holding above the $110,000 support level despite recent volatility. A break below this threshold could signal the start of a bearish trend according to the analysis.
Seasonal factors also support the projected timeline. August and September have historically been weaker performance months for Bitcoin.
Conversely, October and November typically rank among Bitcoin’s strongest months. This seasonal strength pattern aligns with the anticipated cycle peak window.
On-chain metrics remain relatively stable despite recent price weakness. Mining costs hover around $97,124 with no immediate signs of miner capitulation pressure.
Recent exchange-traded fund flows showed $194 million in outflows on August 21. However, overall institutional positions remain substantial across Bitcoin ETF products.
The convergence of cycle analysis, halving mathematics, and seasonal patterns points to a potential climax in Q4 2025.
Get 3 Free Stock Ebooks
Discover top-performing stocks in AI, Crypto, and Technology with expert analysis.
- Top 10 AI Stocks - Leading AI companies
- Top 10 Crypto Stocks - Blockchain leaders
- Top 10 Tech Stocks - Tech giants

