

Key Takeaways
- Binance Coin declined more than 5% in a single trading session, breaching the critical $600 threshold
- Crude oil prices rocketed beyond $110 per barrel following heightened Middle East conflict, creating negative pressure on digital assets
- Technical indicators on the 4-hour timeframe show three successive bearish signals pointing to institutional distribution
- Technical analysis suggests a potential decline to $520 should the downtrend persist
- Daily Relative Strength Index has dipped beneath 40, reinforcing negative market sentiment
Binance Coin has experienced a sharp decline exceeding 5% during the latest trading period, breaking through the psychologically significant $600 threshold that market participants had been monitoring. The cryptocurrency momentarily reached $580 before establishing temporary support at that level.
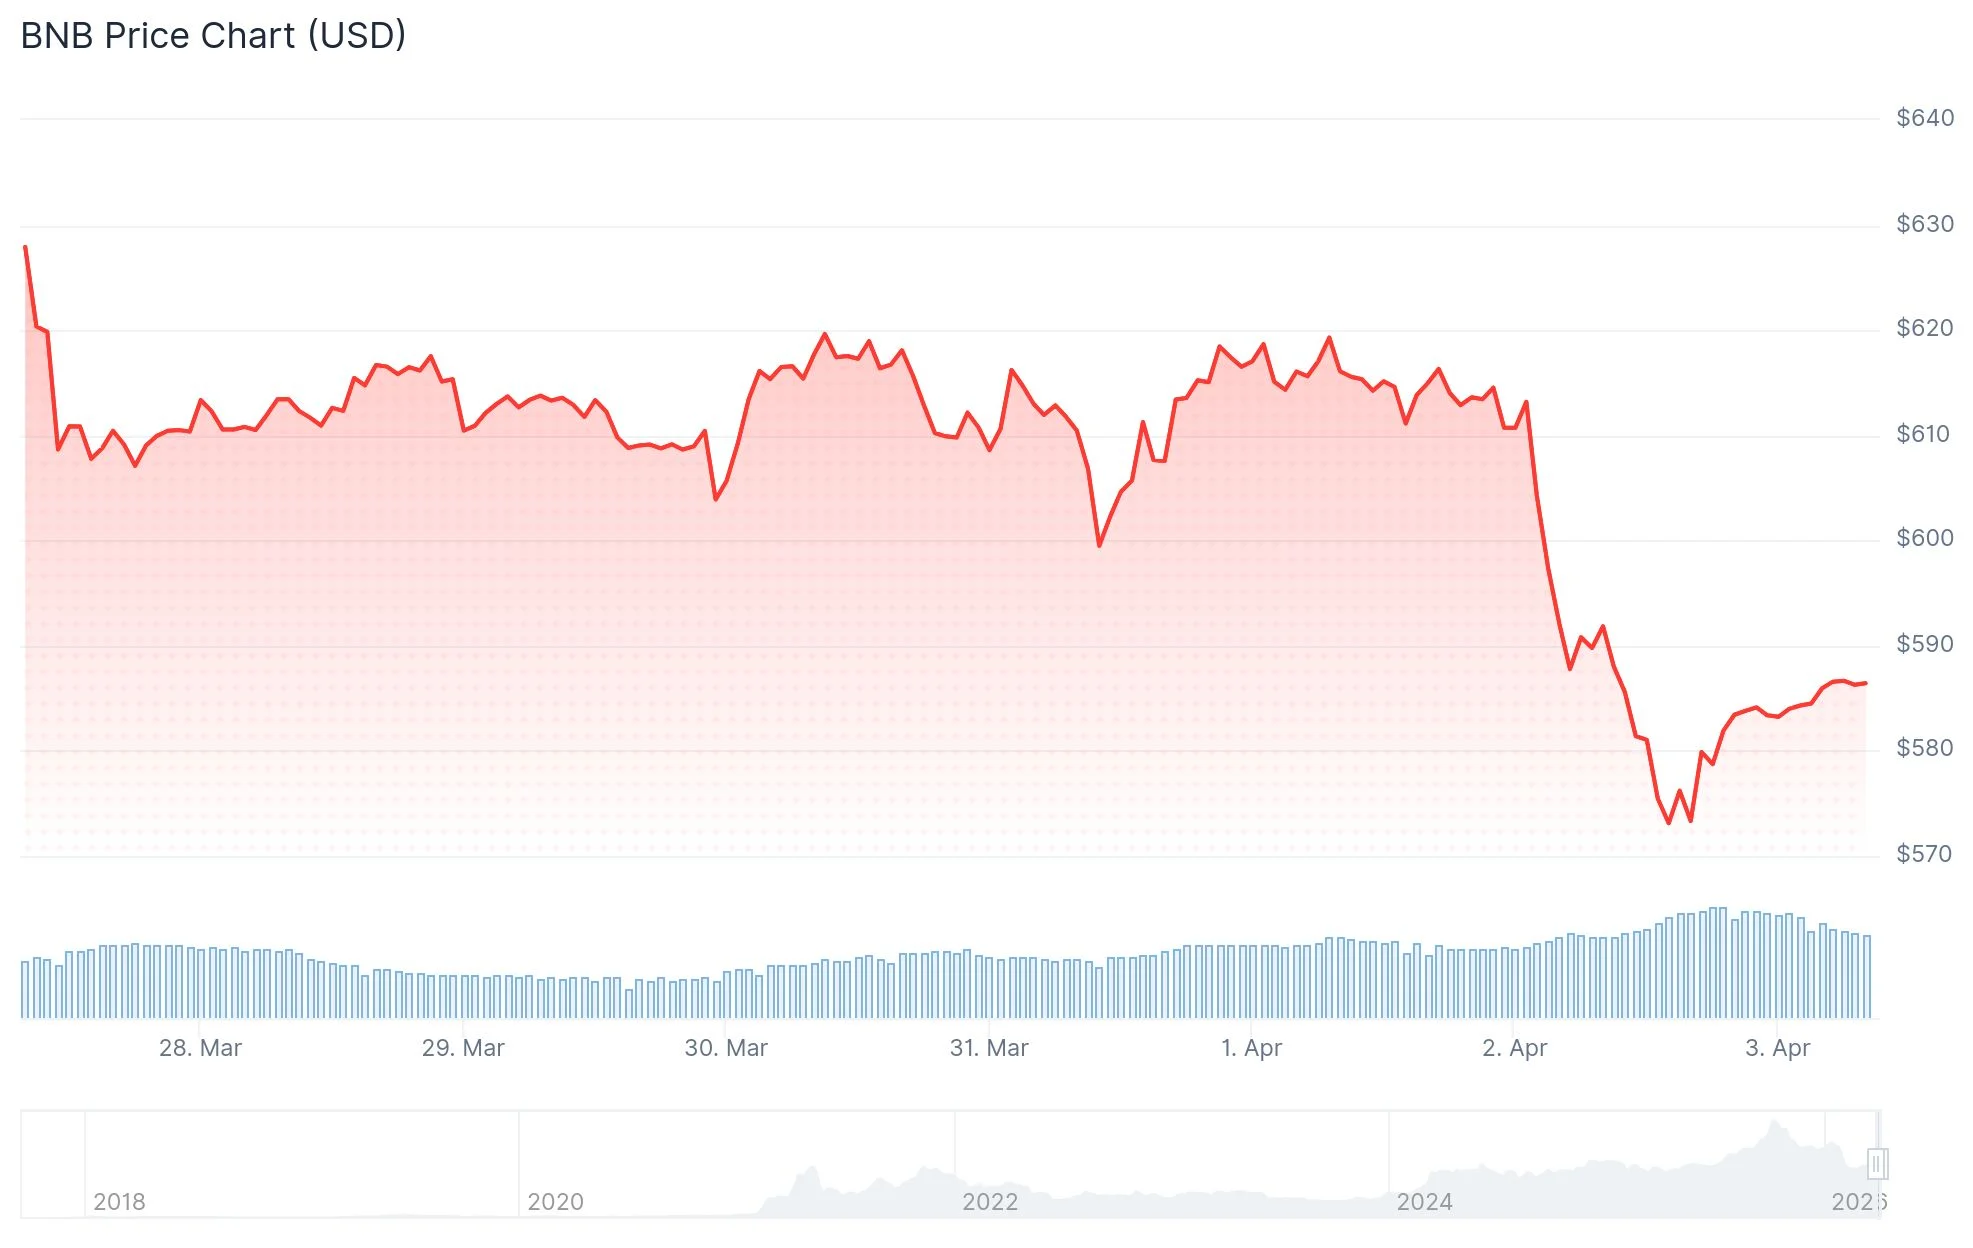
The recent downturn coincides with crude oil surging past the $110 mark. President Trump issued military threats directed at Iran concerning the Strait of Hormuz passage, creating widespread market uncertainty and driving capital away from higher-risk investment vehicles including cryptocurrencies.
BNB’s trading activity increased by 35% over the trailing 24-hour period as the asset challenged the $580 demand area.
Currently positioned at $580, Binance Coin sits 57% beneath its latest peak of $1,360. This substantial differential highlights the significant distribution that has occurred throughout recent months.
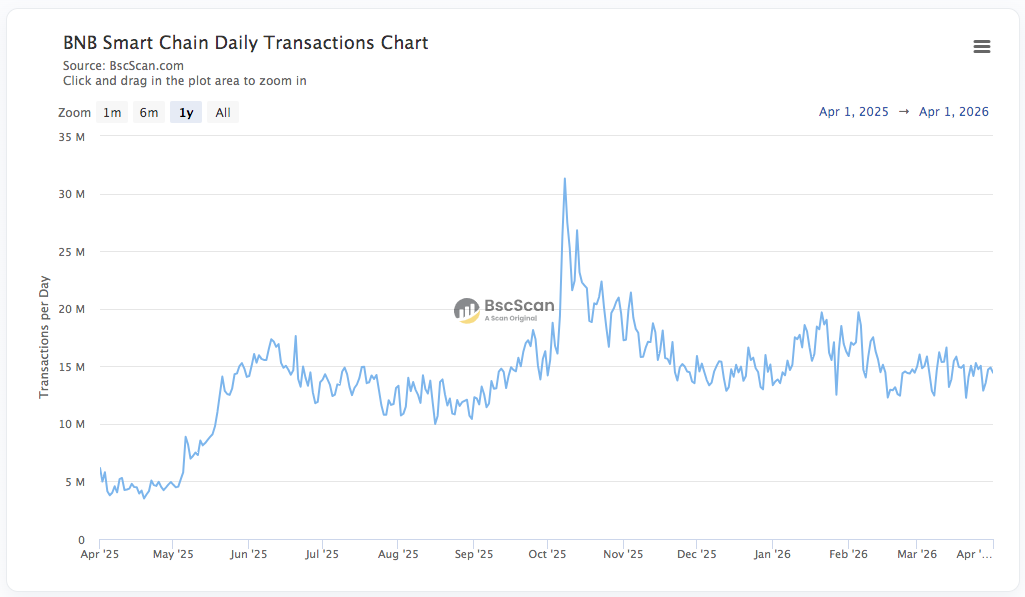
Binance Coin serves two primary functions: providing transaction fee reductions on the Binance exchange and covering gas fees on the BNB Chain network. Blockchain analytics from BSC Scan indicate daily transaction volumes fluctuating between 13 and 19 million, consistent with typical activity levels.

Bearish Momentum Takes Hold
The daily timeframe reveals that BNB has revisited the $580 price region for the third occasion across the past two months. Multiple tests of identical support zones without upward follow-through diminishes the probability of an imminent recovery.
The daily Relative Strength Index has fallen beneath the 40 threshold, a technical development that market analysts interpret as bearish confirmation.
Federal Reserve policy expectations are contributing additional downward pressure. Market forecasters have eliminated rate reduction expectations for 2026. Just thirty days prior, approximately 47% of analysts anticipated a June policy adjustment.
Sequential Bearish Signals Emerge Since Mid-March
The 4-hour chart displays three consecutive distribution signals materializing since March 18. The latest indication emerged following the conclusion of U.S. market hours on April 2.
These technical patterns suggest institutional participants are actively reducing positions. The 4-hour RSI has entered oversold conditions, potentially setting up a short-lived rebound.
Any recovery, should it materialize, might provide short-position traders with more favorable entry opportunities ahead of a possible continuation toward $520.
Market analyst Crypto Patel shared on X that BNB had breached $570 for the first occurrence in more than twelve months. Patel highlighted the $400–$500 range as a significant accumulation area based on Fibonacci retracement levels of 0.5 and 0.618, referencing historical price behavior.
Binance Coin currently competes closely with XRP and USDC for fifth position by total cryptocurrency market capitalization, trailing XRP by merely $1 billion.
The Fear & Greed Index registers at 9, indicating extreme fear pervading the wider cryptocurrency ecosystem.
Get 3 Free Stock Ebooks
Discover top-performing stocks in AI, Crypto, and Technology with expert analysis.
- Top 10 AI Stocks - Leading AI companies
- Top 10 Crypto Stocks - Blockchain leaders
- Top 10 Tech Stocks - Tech giants

