

TLDR
- BNB trades at $1,072 after a 10% weekly decline with technical analysis showing $1,000 as critical support before potential $845 correction.
- Descending triangle breakdown on six-hour charts points to measured downside target of $845 representing 21% drop from current levels.
- Spot taker volume data reveals seller dominance with negative cumulative volume delta indicating more supply than demand in market.
- Applied DNA Sciences bought 4,908 BNB tokens worth $5.3 million with total indirect exposure reaching 10,647 BNB through $27 million investment.
- CEA Industries holds 500,000 BNB tokens purchased at $870 average and targets owning 1% of total supply by year end.
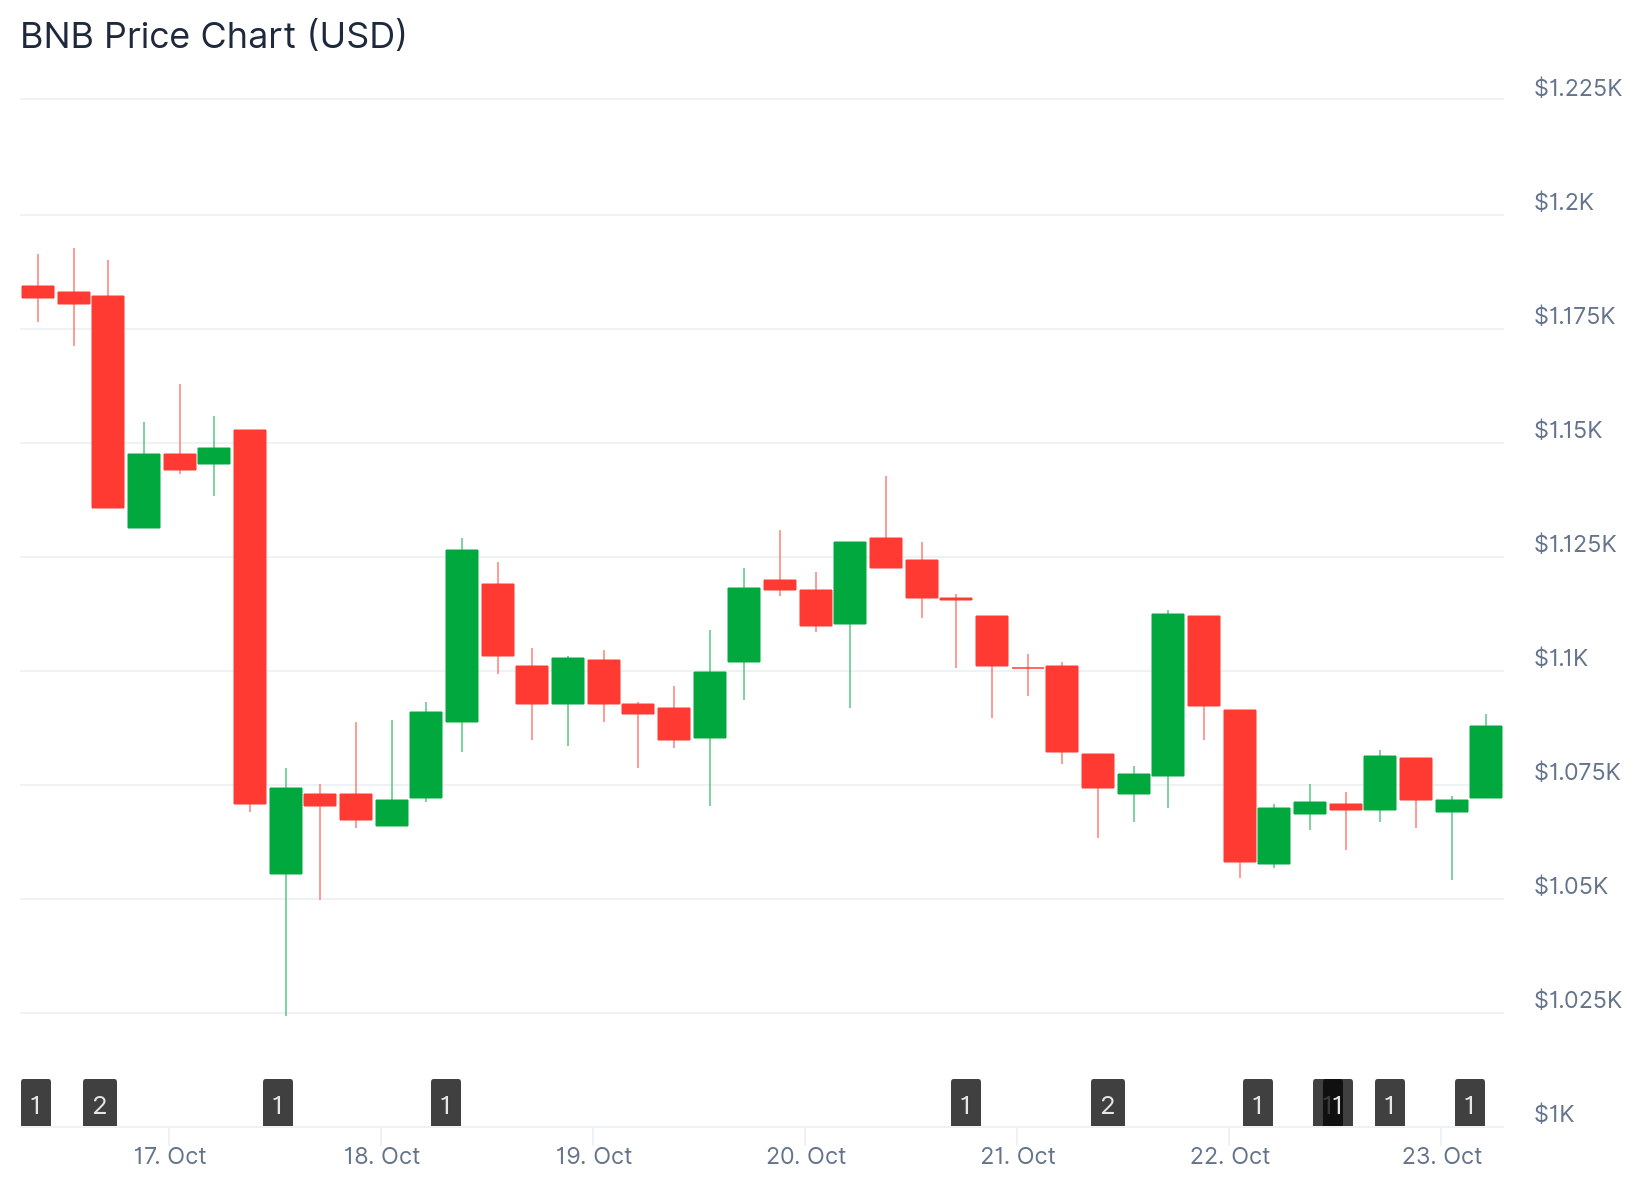
BNB is trading at $1,072 following a 10% decline over the past seven days. The token faces a critical test at the $1,000 support level that could determine its next major move.
Technical analysis and onchain metrics suggest bulls must defend this psychological barrier. Failure to hold could trigger a sharp correction toward $845.
The price dropped to $1,050 earlier this week as selling pressure increased. Buyers are working to push the token back above key resistance levels.
Analyst BlockchainBaller noted BNB is holding around $1,060 support. The analyst said buyers are showing interest at this price point.
A breakout above $1,107 to $1,120 could push prices toward $1,140. These levels align with the 200-period and 50-period simple moving averages.
The next resistance zone sits at $1,180. This matches the 100-period simple moving average location.

Support levels exist between $1,050 and $1,020 on the downside. The lower end was tested on October 15.
The $1,000 level has acted as support since September 30. A close below this could send prices to the $955-$930 range.
A deeper selloff might test the $874 level from the October 11 wick.
Technical Pattern Signals Bearish Breakdown
Chart data shows BNB breaking below a descending triangle pattern on six-hour timeframes. The triangle’s support line sits at $1,069.
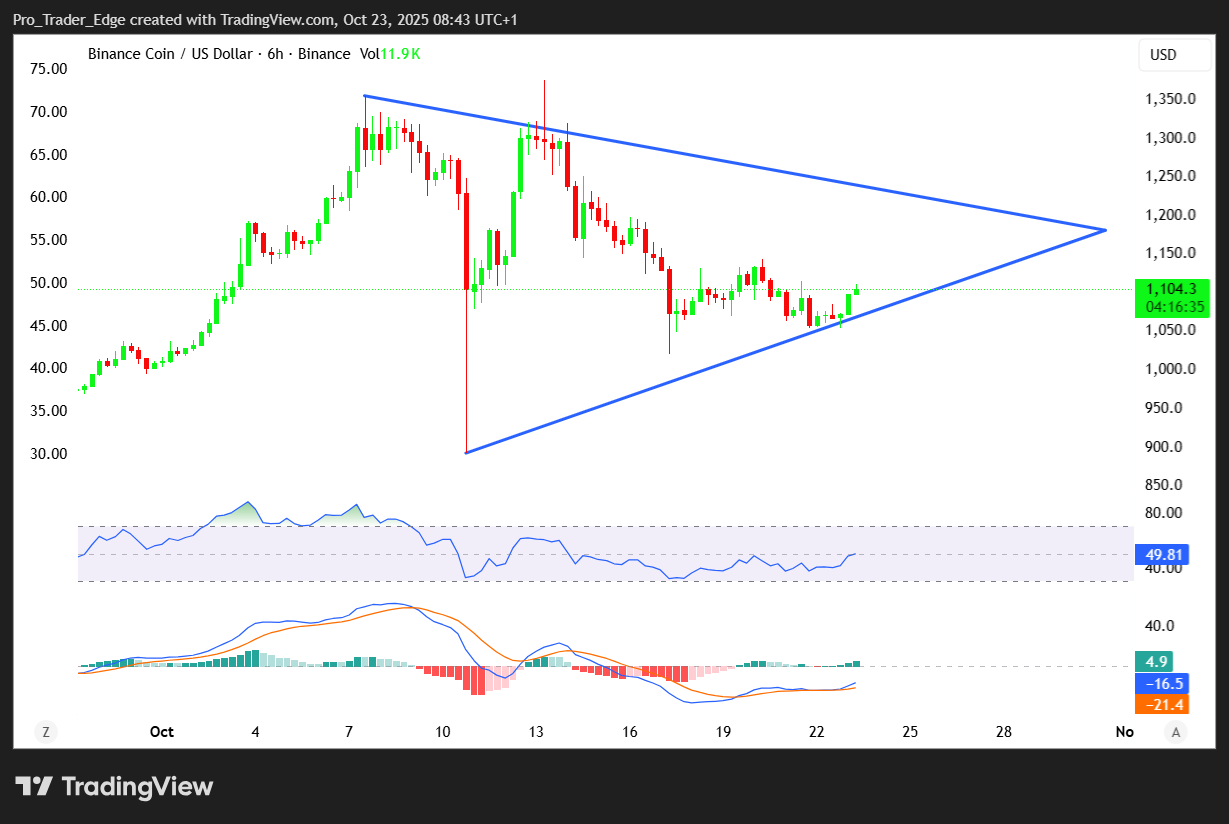
Continued trading below this level projects a measured move to $845. This represents a 21% decline from current prices.
The relative strength index fell from 86 to 41 over two weeks. The indicator now trades below the neutral 50 mark.
Breaking below $1,020 would suggest a short-term top is in place. This would confirm the bearish technical structure.
Volume Data Shows Selling Pressure
The 90-day spot taker cumulative volume delta turned negative last Friday. This metric tracks the difference between buying and selling volume.
Sellers have controlled the order book since BNB peaked at $1,375. Negative readings indicate profit-taking among traders.
More sell orders are hitting the market than buy orders. Most current holders remain in profit at these levels.
This supply-demand imbalance typically precedes further price corrections. The data suggests continued downward pressure.
Corporate Accumulation Continues
Applied DNA Sciences purchased 4,908 BNB tokens valued at $5.3 million. The biotech company’s stock surged over 50% after announcing the buy.
The purchase came through a $27 million private investment deal. Applied DNA now has indirect exposure to 10,647 BNB total pending shareholder approval.
Chief investment officer Patrick Horsman said the firm will implement a yield-focused treasury strategy. The approach centers on direct and indirect BNB exposure.
CEA Industries bought 500,000 BNB tokens at an average $870 price. The Canadian company announced its BNB treasury focus in July.
CEA is now the largest corporate BNB holder. The firm aims to own 1% of total supply by December 31.
China Renaissance Holdings reportedly plans to raise $600 million for a BNB-focused digital asset treasury. The Beijing-based investment bank announced the plans in October.
BNB became the third-largest cryptocurrency by market cap on October 7. The token hit an all-time high of $1,370 on October 13 but has since fallen 21% to current levels around $1,080.
Get 3 Free Stock Ebooks
Discover top-performing stocks in AI, Crypto, and Technology with expert analysis.
- Top 10 AI Stocks - Leading AI companies
- Top 10 Crypto Stocks - Blockchain leaders
- Top 10 Tech Stocks - Tech giants

