
 Price Analysis: Major Whale Buying Surge as Stablecoin Reserves Soar 100% YoY")
Key Highlights
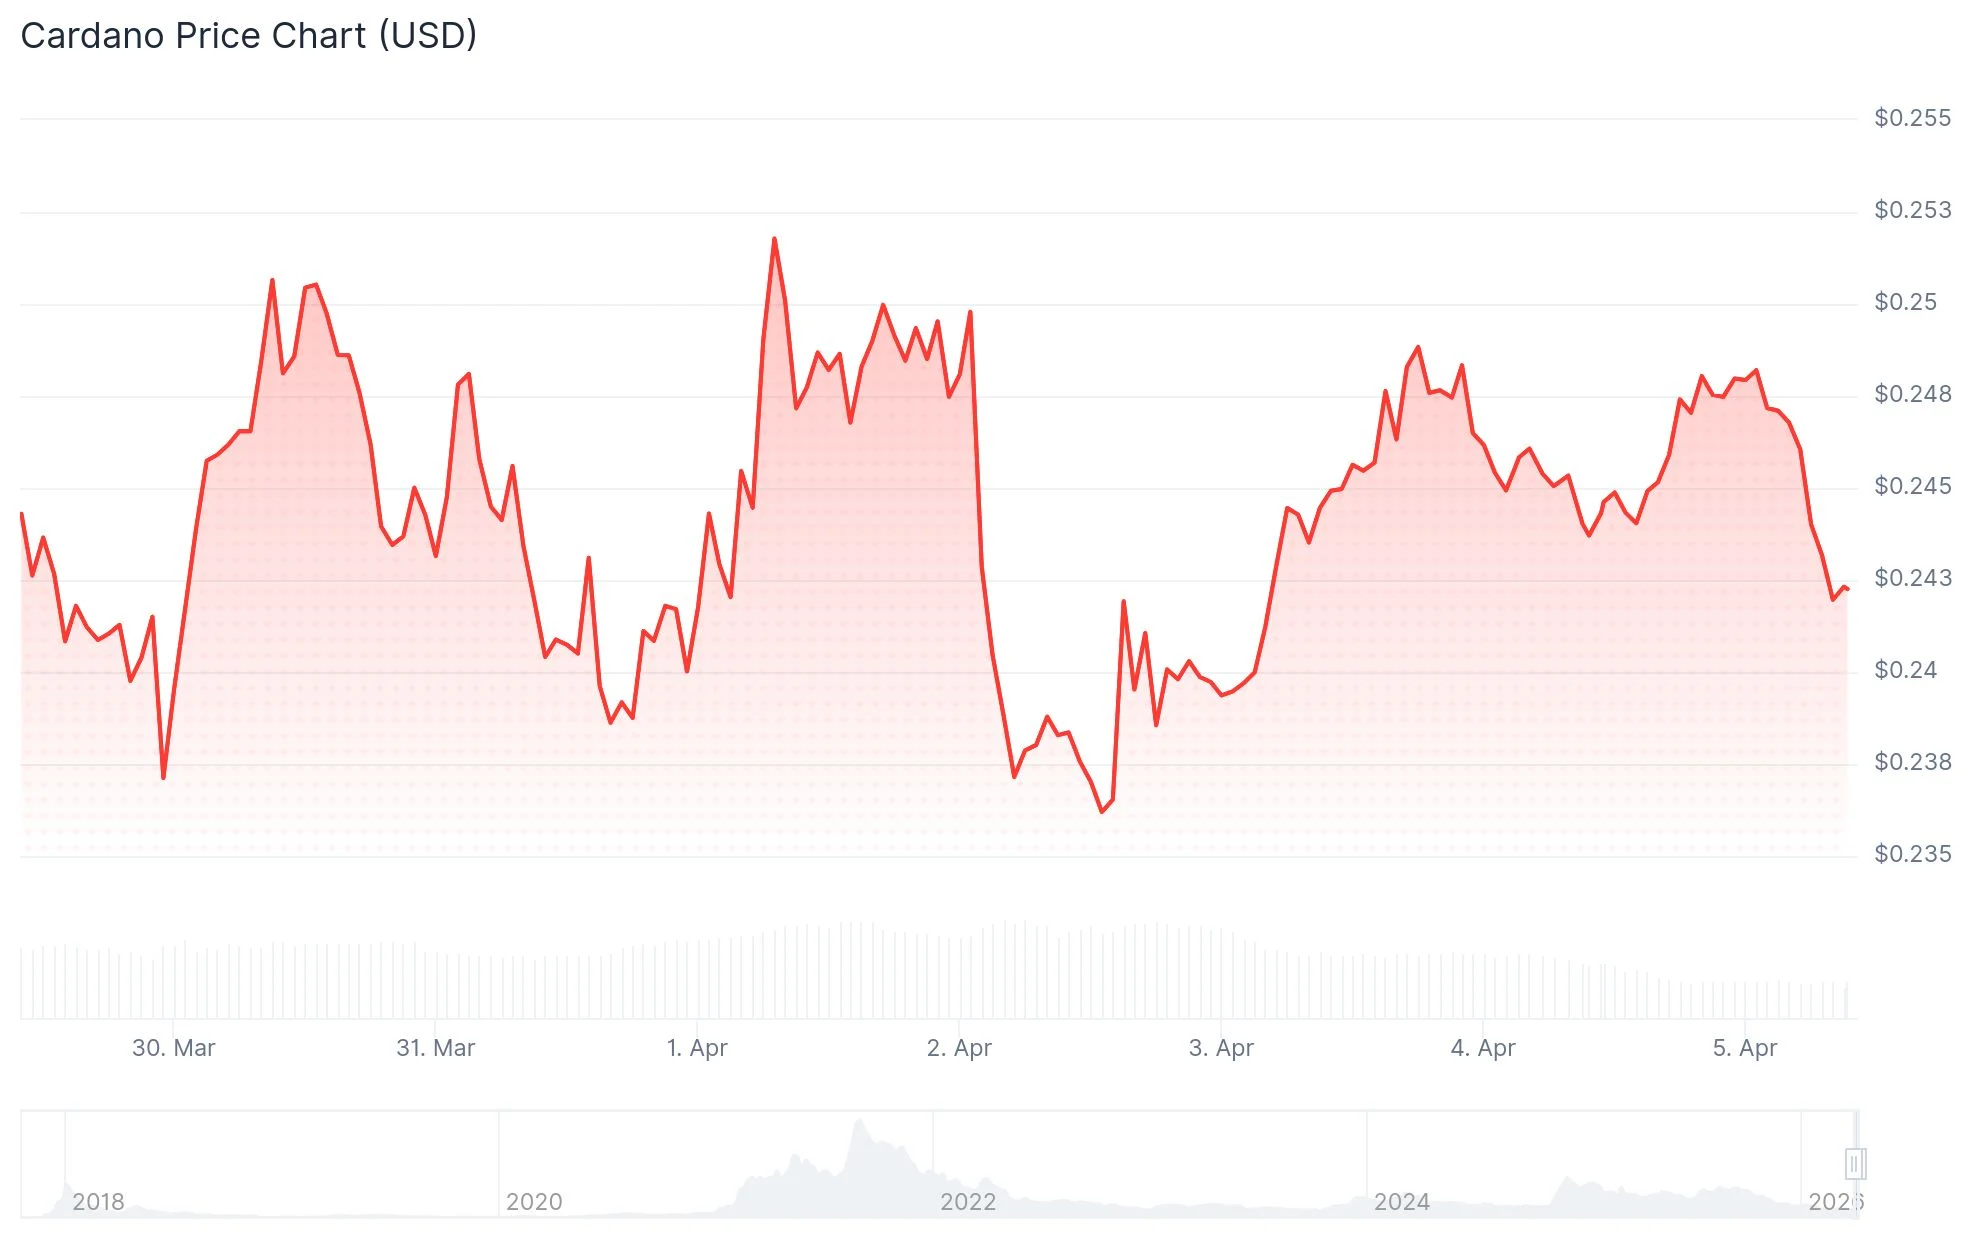
- ADA maintains position around $0.24 with critical support established at $0.23
- Stablecoin liquidity on Cardano network has surged over 100% compared to last year
- Large holder accumulation patterns have intensified throughout March, particularly during downturns
- Network metrics demonstrate stabilization following extended bearish period
- Technical analyst MasterAnanda identifies potential rally to $1.05 using Fibonacci analysis
Cardano (ADA) currently hovers around the $0.24 mark following a recent decline to $0.2342 on March 31 — marking the lowest valuation since February 6, when the token touched $0.220. The digital asset has experienced approximately 5.8% depreciation over the last 24 hours, reflecting broader market weakness affecting alternative cryptocurrencies.
However, beneath the surface price action, blockchain metrics paint a more optimistic picture. The aggregate stablecoin supply deployed on Cardano’s network has increased by more than 100% year-over-year, establishing fresh cycle peaks. This expansion represents significant capital availability positioned within the Cardano infrastructure.
The $0.23–$0.28 corridor represents an established accumulation zone. ADA previously navigated these price levels during August 2024, subsequently initiating a powerful advance that peaked at $1.32 by December 2024.
Large holder behavior patterns have demonstrated notable changes. Analytics monitoring the differential between whale and retail positioning reveal increasingly robust and frequent accumulation episodes beginning in early March. These buying patterns consistently emerge near range support levels, indicating institutional-scale participants are strategically acquiring positions during price weakness.
Blockchain engagement metrics have reached an inflection point. Active address counts and transactional volume data confirm the previous declining trend has stabilized. This leveling off arrives after an extended downward trajectory and could signal foundational support development.

Technical Analysis Points to Multi-Level Price Targets
TradingView technical analyst MasterAnanda identified the March 31 pullback as a potentially favorable entry opportunity. He characterized this movement as establishing a higher low formation, which he interprets as an attractive buying zone within the existing support structure.
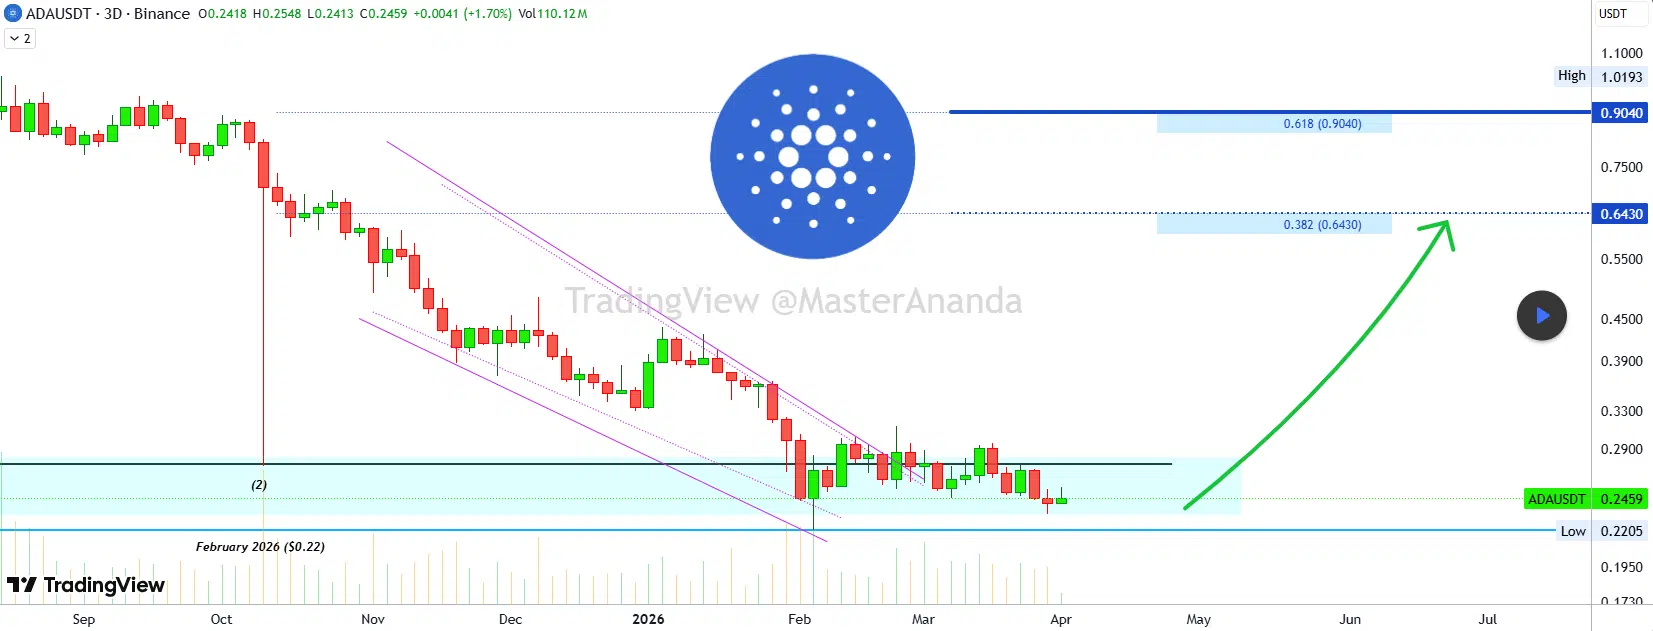
His technical framework identifies the 0.382 Fibonacci retracement benchmark at $0.643 and the 0.618 retracement level at $0.904. He further noted potential extension toward $1.05.
MasterAnanda suggested a leveraged long position strategy using 10x leverage with 5% capital allocation, establishing entry parameters between $0.2050 and $0.2500. The invalidation point sits at a weekly candle close beneath $0.2230. Should price action reach the maximum target, this configuration would yield approximately 3,270% returns.
Critical Price Zones Ahead
On the resistance front, $0.27 represents the immediate overhead barrier. The $0.33 threshold stands as the crucial breakout level. Sustained movement beyond this zone would establish trajectory toward the $0.40–$0.50 range.
Should Cardano surrender the $0.23 support threshold, the bullish accumulation thesis would be compromised, opening pathways for additional downside pressure.
Bitcoin has demonstrated strength, recovering from below $65,000 to surpass $68,000 in recent sessions. Ethereum successfully recaptured $2,100 before experiencing modest retracement while maintaining position above $2,000. This broader cryptocurrency market stability provides constructive backdrop for ADA performance.
As of publication, ADA trades near $0.2357, marginally above the March 31 intraday low of $0.2342.
Get 3 Free Stock Ebooks
Discover top-performing stocks in AI, Crypto, and Technology with expert analysis.
- Top 10 AI Stocks - Leading AI companies
- Top 10 Crypto Stocks - Blockchain leaders
- Top 10 Tech Stocks - Tech giants

