
 Price: Analysts Eye $4 Target Despite 26% Crash")
TLDR
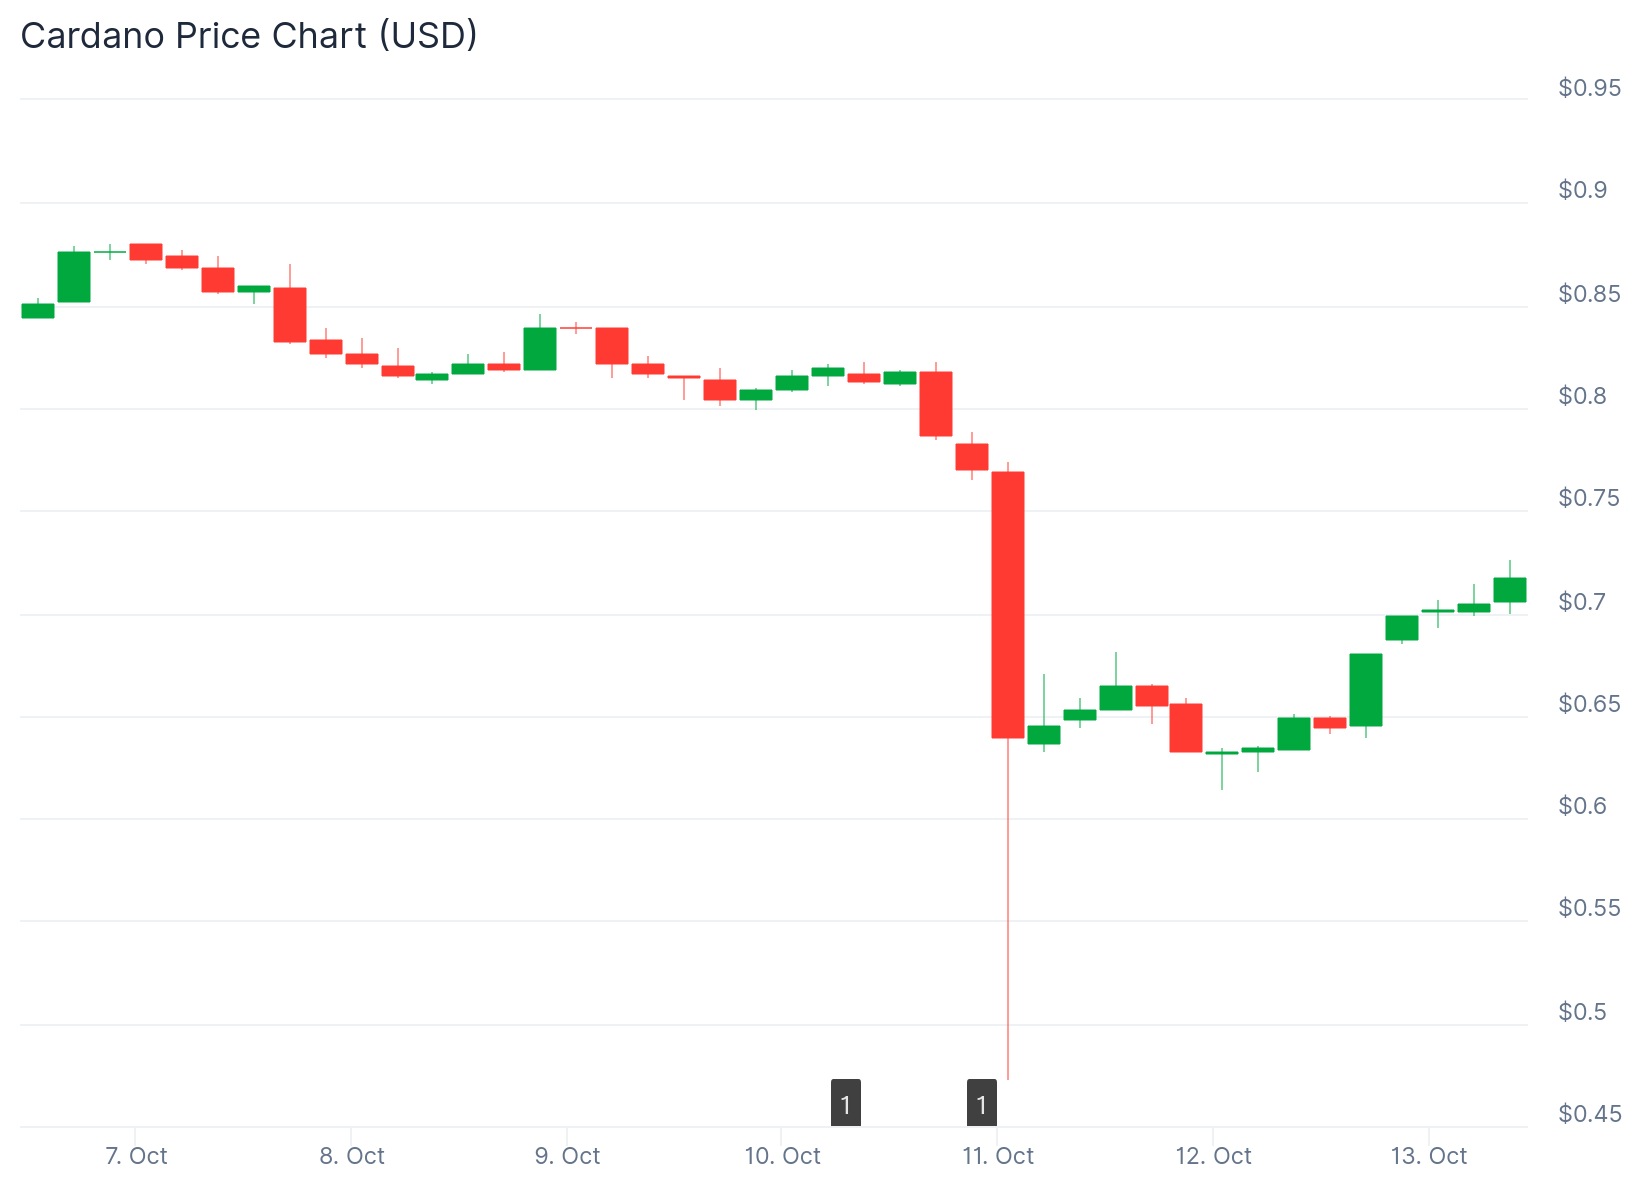
- Cardano (ADA) is trading at $0.65 after falling 1.36% in 24 hours and 25% over the past week.
- A symmetrical triangle pattern forming in 2025 suggests a potential breakout could push ADA toward $2, representing a 200% gain.
- The $0.69 support level is critical for maintaining bullish momentum and preventing further downside.
- Analyst Sssebi expects a rebound to $0.80 in coming weeks, while CaptToblerone sees a path to $4 if resistance breaks.
- Current price action mirrors Cardano’s 2021 pre-bull run setup when the token later surged to $3.
Cardano (ADA) dropped 1.36% in 24 hours on October 12, 2025, continuing a steep decline. The token fell 25.45% over the past week and 28.13% for the month. ADA traded near $0.65 at press time.
The current price sits far below Cardano’s all-time high of $3.10 from 2021. However, technical analysts are spotting patterns that could signal a reversal is approaching.
Market watchers have identified a symmetrical triangle pattern developing throughout 2025. This formation shows price compressing between rising lows and falling highs. Such consolidation typically precedes a breakout in either direction.
Most analysts expect the next major move will be upward. The pattern suggests volatility could return and push ADA into a new bullish phase. A confirmed breakout could trigger a substantial rally.
The $0.69 price level has emerged as the critical support zone. If ADA maintains this floor, it could activate a series of upside targets. The first resistance sits at $0.95.
Beyond that level, the token would need to clear the $1.15 to $1.35 range. If momentum continues, analysts project ADA could reach $1.90 or even $2 by early 2026. This represents more than a 200% increase from current prices.

A break below $0.69 would invalidate the bullish setup. That scenario would likely delay any rally and shift attention to lower support areas around $0.55 to $0.58.
2021 Pattern Repeating
Observers are drawing parallels between current conditions and Cardano’s behavior before its 2021 bull run. Back then, ADA consolidated in a similar range before exploding to new highs near $3.
The token is now testing long-term channel support again. This mirrors the historical pattern that preceded the previous major rally. Analysts believe ADA may be entering a crucial accumulation phase.
Many long-term holders view this period as an opportunity to build positions before the next cycle begins. The technical setup suggests patient investors could benefit from current price levels.
Some traders remain cautious about timing. Resistance around the $1.10 to $1.30 Fibonacci zones has capped rallies multiple times in recent months. Until ADA clears these levels, price may continue range-bound trading.
Analyst Targets and Key Levels
Analyst Sssebi described the pullback as temporary in posts on X. He outlined a potential recovery path toward $0.80 in the coming weeks. This would mark a rebound without disrupting the longer-term pattern.
Elliott Wave analyst CaptToblerone presented a bullish scenario. He suggested the decline represents a correction within a larger upward trend. His chart identified support near $0.58 based on Fibonacci retracement levels.
CaptToblerone stated that a move above $0.80 would confirm trend continuation. That breakout could open the path toward a $2 to $4 target zone over the longer term. The forecast depends on support holding at identified levels.
Traders are monitoring several key zones. The $0.67 to $0.70 area serves as immediate resistance. A stronger ceiling exists near $0.75, where previous attempts stalled.
The $0.58 to $0.55 band represents the next major support. A bounce from this zone would suggest base formation. Failure to hold would expose deeper levels from earlier trading ranges.
Moving averages on multiple timeframes show Cardano breaking below short-term trends. This technical weakness added bearish pressure during recent sessions. However, the weekly chart structure remains intact and shows a broader sideways-to-upward bias.
Development and Community Activity
Community discussions highlighted ongoing network development as a positive factor. Progress on scaling solutions like Hydra and Mithril continues. High staking participation rates signal long-term holder commitment to the Cardano ecosystem.
Trading forum sentiment remained analytical after the price drop. Participants debated whether the move was a shakeout or trend reversal. Most traders await confirmed breaks of key levels before taking new positions.
Volume patterns around swing highs and lows suggest positioning resets typical before larger directional moves. Liquidity shifts often accompany such shakeouts in the market.
The $0.69 level remains the line in the sand for near-term direction. A hold above this support with increasing volume would support the bullish case. Breaking below opens the door to testing lower support bands.
Get 3 Free Stock Ebooks
Discover top-performing stocks in AI, Crypto, and Technology with expert analysis.
- Top 10 AI Stocks - Leading AI companies
- Top 10 Crypto Stocks - Blockchain leaders
- Top 10 Tech Stocks - Tech giants

