
 Price Prediction: Bulls Eye $0.95 Target After Falling Wedge Breakout")
TLDR
- Cardano confirms descending wedge breakout above $0.86 support
- Open Interest rises 6.51% to $1.78 billion showing increased futures activity
- Spot outflows of $2.51 million indicate reduced selling pressure
- Parabolic SAR flips bullish for first time in weeks
- Technical targets point to $0.95-$1.00 resistance zone
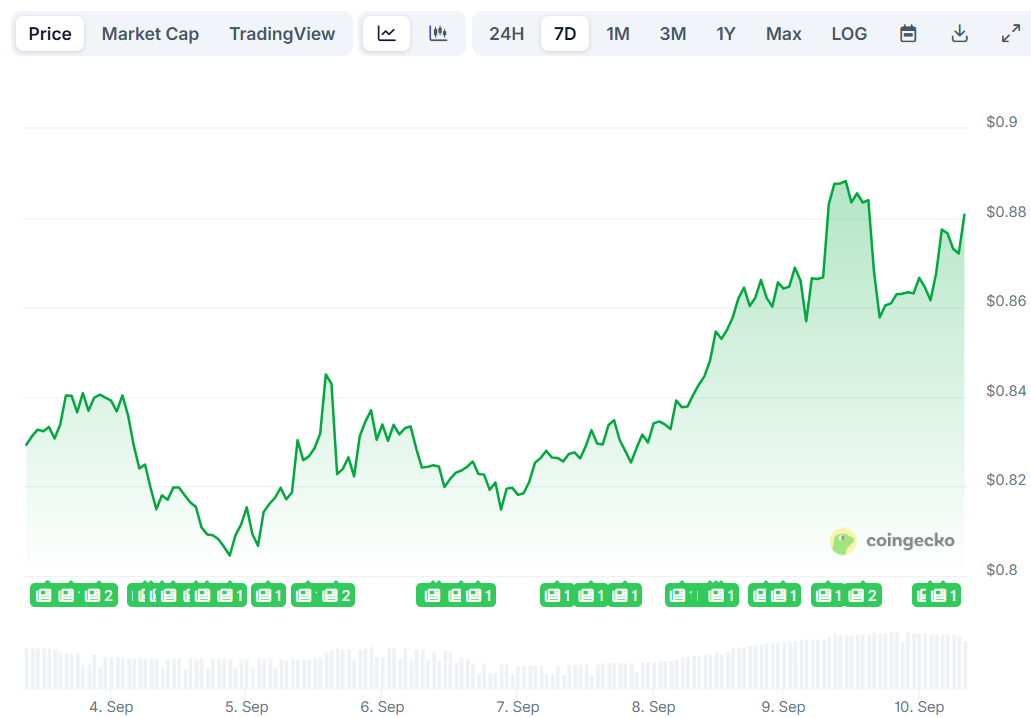
Cardano has broken out of a descending wedge pattern, trading around $0.89 after reclaiming key support at $0.86. This technical development signals a potential shift in momentum following weeks of consolidation.
The breakout invalidates previous downward pressure from the wedge’s lower trendline. Directional Movement Index data shows strong buyer control with +DI at 32 versus -DI at 6.
An ADX reading of 31 confirms the breakout has solid momentum backing. This technical strength suggests the move higher has conviction rather than being a false breakout.
The cryptocurrency now faces resistance levels at $0.95 and $1.01. Breaking above these zones could unlock further upside potential.
Derivatives Market Shows Growing Interest
Futures market activity has increased substantially with Open Interest jumping 6.51% to reach $1.78 billion. This influx of capital into ADA derivatives markets reflects growing trader confidence.
Rising Open Interest typically precedes stronger price movements in cryptocurrency markets. However, it can also increase volatility and create sharper price swings.

Binance positioning data reveals 73.13% of accounts are long ADA compared to 26.87% short. This creates a Long/Short ratio of 2.72, showing bullish sentiment among retail traders.
The Parabolic SAR indicator has flipped bullish with dots appearing below price action. This technical signal historically preceded major rallies in ADA, including a previous 200% gain.
Spot Market Dynamics Support Rally
Exchange netflows show $2.51 million moving off trading platforms in the latest daily reading. These outflows suggest investors are removing tokens from exchanges, typically reducing selling pressure.
Sustained outflows often coincide with accumulation phases where holders prefer long-term storage over active trading. This behavior pattern has historically supported price appreciation.
The bull pennant formation that developed between $0.78-$0.85 has now resolved to the upside. Similar patterns in ADA’s history have produced rallies exceeding 40%.
Fibonacci retracement levels align with the $0.90-$0.92 resistance zone. These technical levels often act as decision points where momentum either continues or stalls.
Cardano Price Prediction
Technical analysis suggests ADA could target the $0.95 level in the near term if current momentum persists. The combination of wedge breakout, rising derivatives interest, and spot outflows creates a favorable setup.
Historical bull pennant patterns indicate potential for a 30% rally from current levels. This would bring price toward the psychological $1.00 resistance level.
Key support remains at $0.86, and maintaining this level is crucial for the bullish scenario. A break below could invalidate the current technical setup and lead to retesting lower support zones.
The alignment of multiple bullish indicators suggests upward momentum may continue, with $0.95 representing the immediate target and $1.00 as the next major resistance level.
Get 3 Free Stock Ebooks
Discover top-performing stocks in AI, Crypto, and Technology with expert analysis.
- Top 10 AI Stocks - Leading AI companies
- Top 10 Crypto Stocks - Blockchain leaders
- Top 10 Tech Stocks - Tech giants

