
 Price Prediction: Bulls Target $0.92 After Falling Wedge Breakout")
TLDR
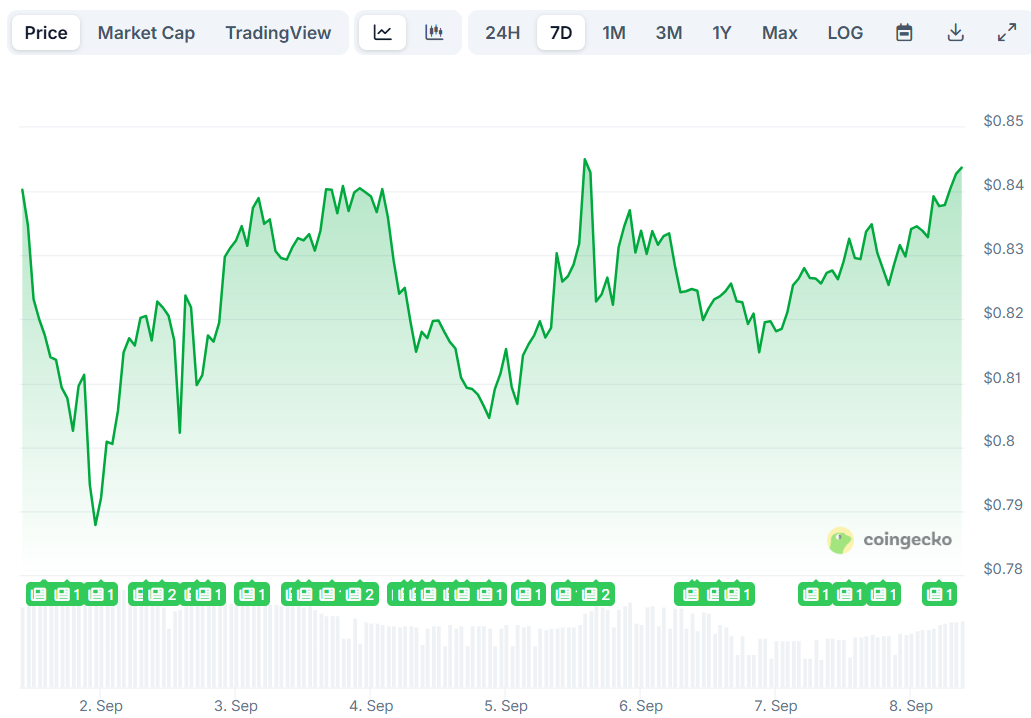
- Cardano trades above $0.84 after breaking out of falling wedge pattern
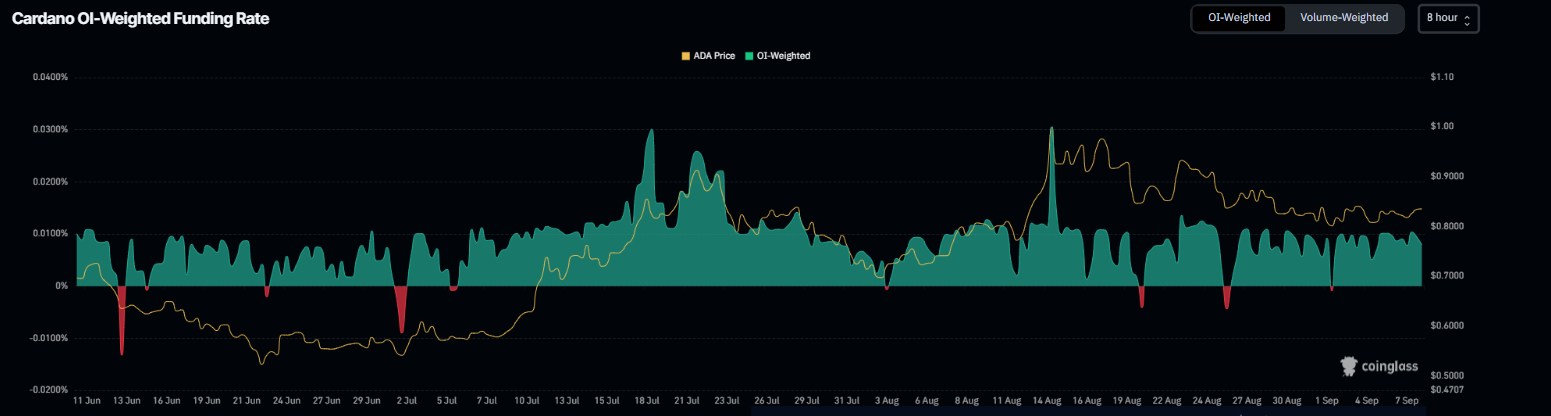
- Positive funding rates and $40.37 million stablecoin market cap record support bullish outlook
- Key resistance at $0.85-$0.92 with support holding at $0.77-$0.82
- Bitcoin stability above $110K creates favorable environment for altcoin gains
- RSI and MACD indicators confirm bullish momentum on multiple timeframes
Cardano has surged above $0.84 following a successful breakout from a falling wedge pattern. The altcoin shows strong momentum after defending key support levels last week.
Market conditions remain favorable for continued gains. Bitcoin holds steady above $110,000, creating an environment where liquidity often rotates into altcoins during consolidation periods.
The broader crypto market cap stalled below $4 trillion after August highs. This sideways movement typically precedes larger breakouts and provides opportunities for altcoins to outperform.
Derivatives data reveals improving sentiment among Cardano traders. Coinglass funding rates flipped positive on September 2 and maintained 0.0079% on Monday. This indicates more traders expect price increases rather than declines.
On-chain metrics strengthen the bullish case. ADA stablecoin market capitalization reached a record $40.37 million on Sunday according to DefiLlama. Rising stablecoin activity increases network usage and attracts new ecosystem participants.
Technical Analysis Confirms Bullish Setup
The 4-hour chart shows Cardano broke above its falling wedge pattern on Sunday. This technical formation, created by connecting highs and lows since August 14, typically favors upward price movement.

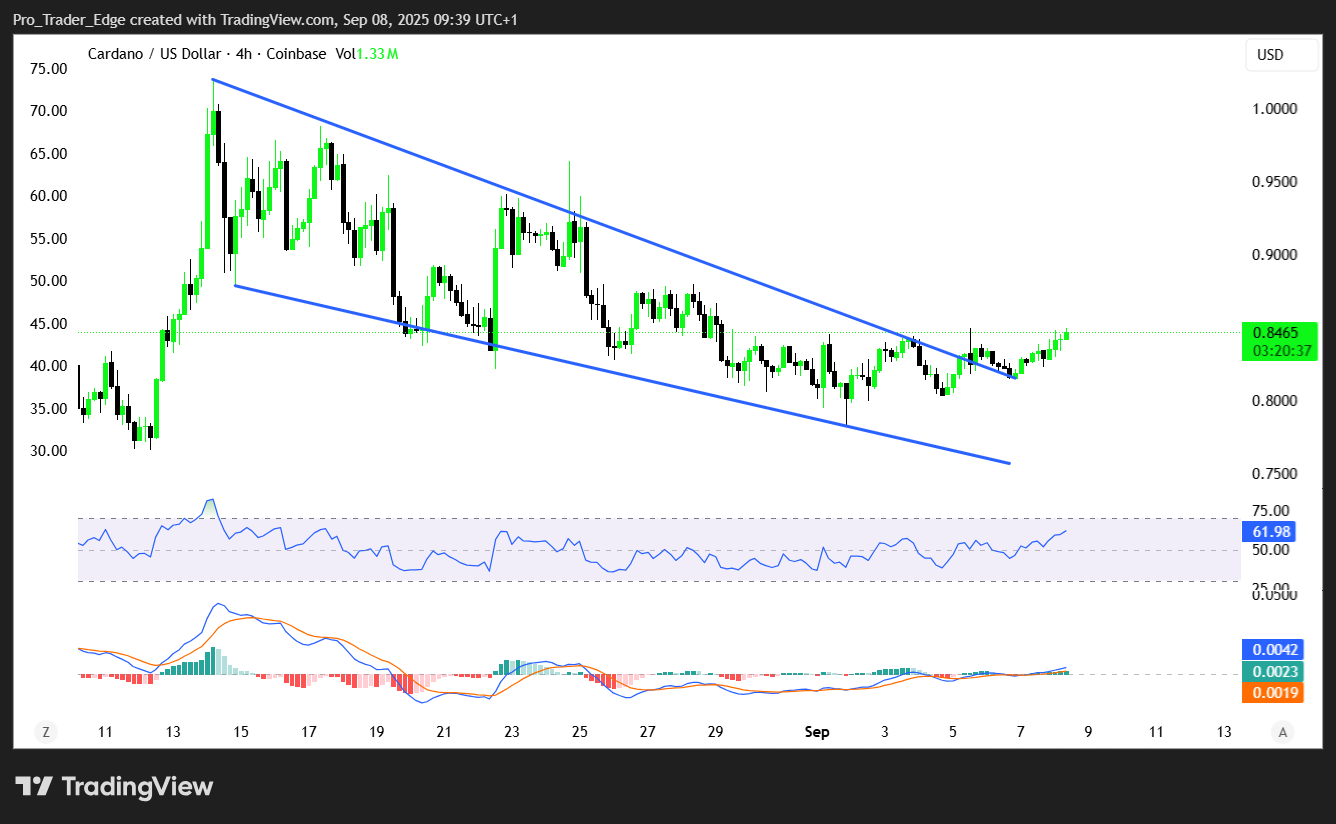
Technical indicators support the breakout. The RSI reads 58 on the 4-hour timeframe, above the neutral 50 level. The MACD displayed a bullish crossover, reinforcing positive momentum signals.
Daily chart analysis reveals Cardano found support at its 100-day Exponential Moving Average around $0.77 on September 1. The token recovered 4.19% through Sunday and maintains gains above this critical level.
The daily RSI hovers near 50, indicating trader indecision. For sustained rally continuation, this indicator needs to break above neutral territory. The MACD shows falling red histogram bars below neutral, suggesting weakening bearish pressure.
Cardano Price Prediction
Price targets depend on sustained momentum above current levels. If ADA maintains upward movement, the 61.8% Fibonacci retracement at $0.92 represents the next target.
A daily close above $0.84 resistance could extend gains toward the August 14 high of $1.02. This level coincides with psychological resistance at $1.00.
Short-term resistance sits at $0.83-$0.85 where the 50-day Simple Moving Average creates a horizontal barrier. Breaking this zone could trigger momentum toward higher targets.
Support levels remain well-defined. The 100-day EMA at $0.77 provides immediate support, with the 200-day SMA at $0.72 offering additional backing. Deeper support exists at $0.62 if broader market conditions deteriorate.
Risk factors include Bitcoin weakness below $110,000 and overall crypto market cap breakdown below current support levels. However, current technical and fundamental data support continued upward price action for Cardano in the near term.
Get 3 Free Stock Ebooks
Discover top-performing stocks in AI, Crypto, and Technology with expert analysis.
- Top 10 AI Stocks - Leading AI companies
- Top 10 Crypto Stocks - Blockchain leaders
- Top 10 Tech Stocks - Tech giants

