
 Price Prediction: Dormant Wallets Wake Up as Trendline Support Breaks")
TLDR
- Cardano (ADA) broke below key ascending trendline, confirming bearish correction phase
- Dormant wallet activity surged, creating selling pressure as old holders move tokens
- Technical indicators including RSI at 40 and MACD crossover support downward momentum
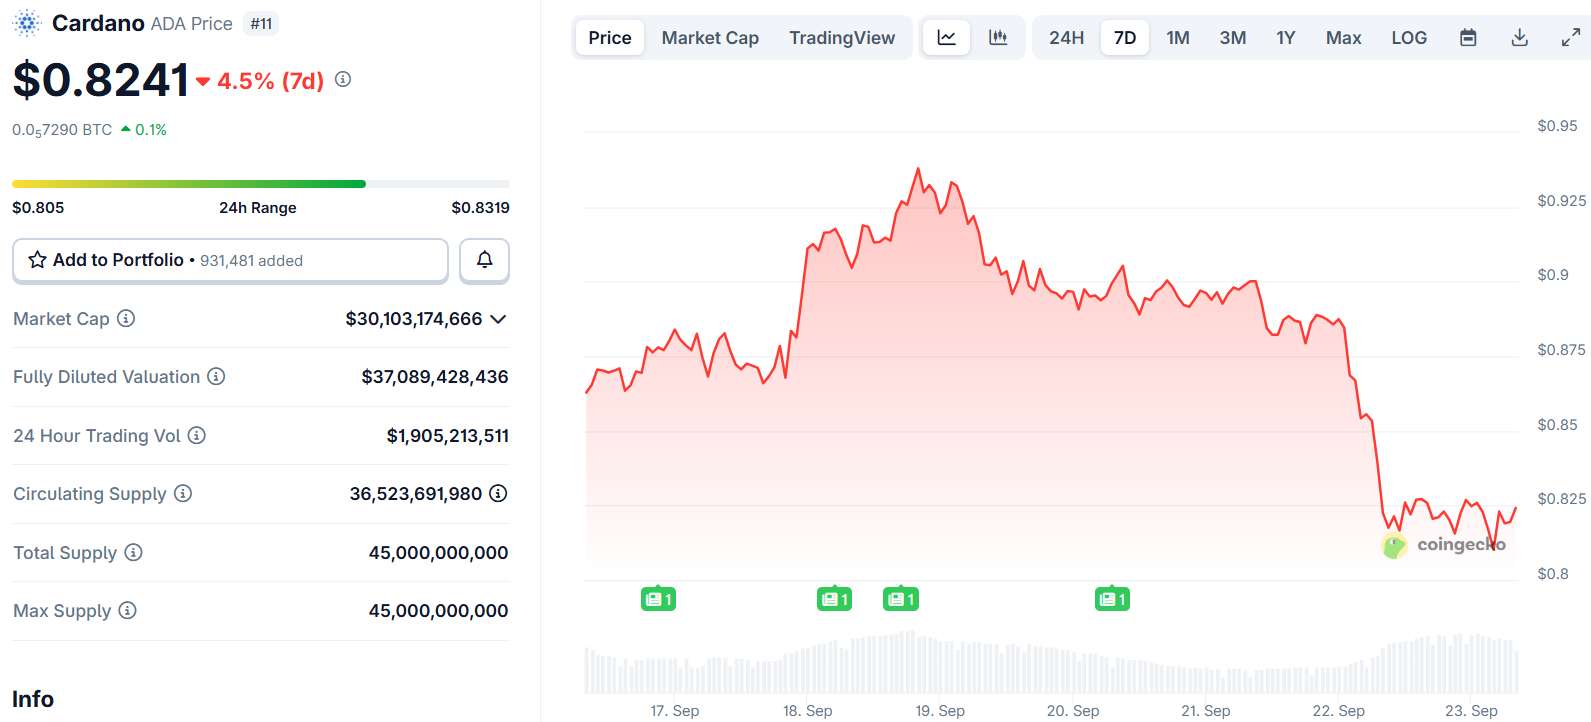
- Current price around $0.81 after 6.1% Monday decline below $0.84 support
- Bears targeting $0.76 level representing 50% Fibonacci retracement from summer range
Cardano has entered a correction phase after breaking below a crucial ascending trendline that supported prices since early July. The cryptocurrency currently trades at $0.81, extending losses from the previous $0.84 support zone.
The technical breakdown coincides with increased activity from dormant wallets. These long-inactive addresses are transferring tokens to exchanges, creating fresh selling pressure on the market.
On-chain analytics from Santiment show spikes in the Age Consumed index, which tracks dormant token movements. Historical data reveals that similar spikes have preceded local price tops as holders liquidate positions.
%20[07-1758596946833-1758596946836.32.59,%2023%20Sep,%202025].png)
Volume Metrics Confirm Selling Pressure
CryptoQuant data reinforces the bearish outlook through the Taker Cumulative Volume Delta (CVD) indicator. This metric has remained negative since mid-August, showing sustained selling dominance over buying interest.
%20(1)-1758596968053-1758596968055.png)
The 90-day CVD measures cumulative differences between market buy and sell volumes. When negative and declining, it indicates a Taker Sell Dominant Phase where sellers control price action.

ADA’s persistent negative CVD readings suggest institutional and retail participants favor selling over accumulation. This trend creates headwinds for any potential recovery attempts.
The combination of dormant wallet activity and negative volume flows presents a challenging environment for bulls attempting to regain control.
Technical Analysis Points Lower
Daily chart analysis shows ADA violated its ascending trendline connecting multiple lows from July through September. This trendline break represents a shift from bullish to bearish market structure.
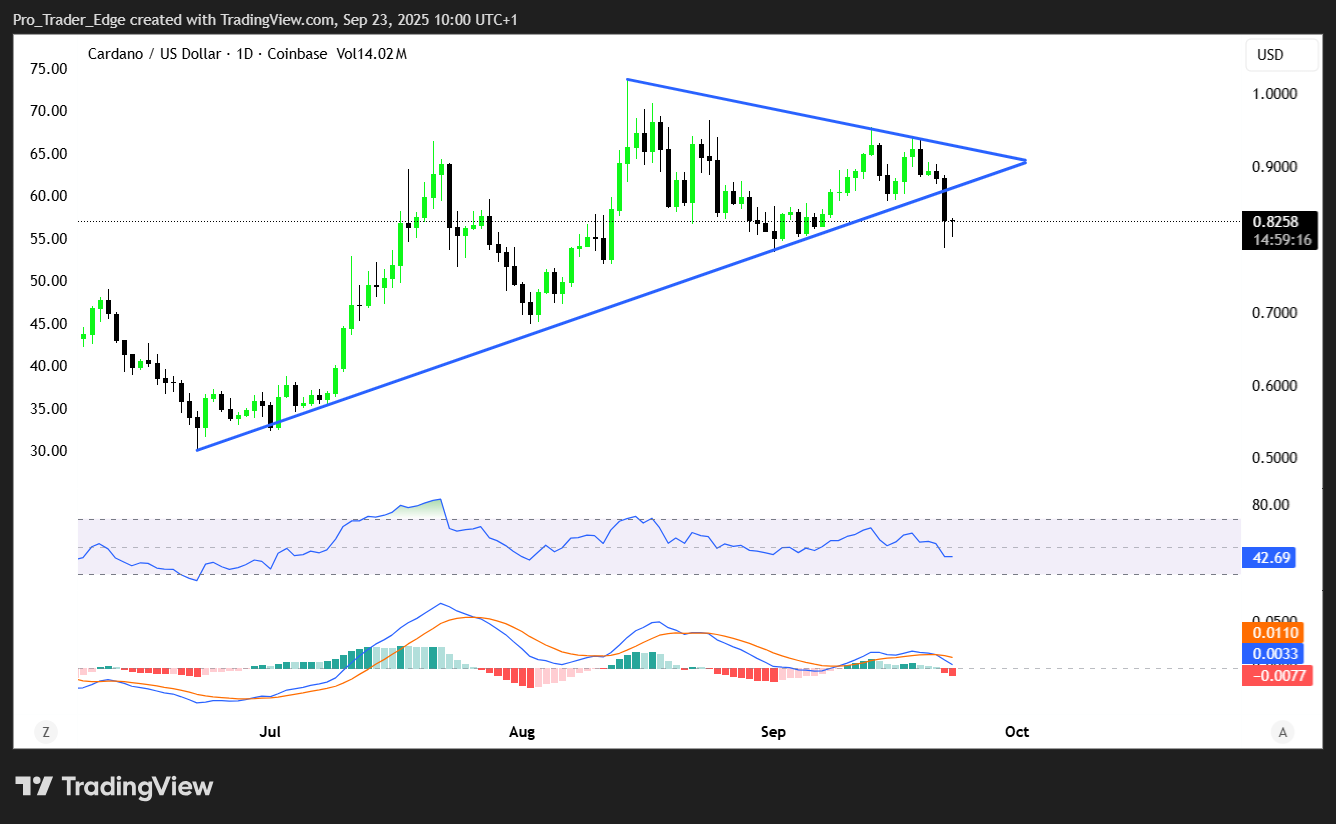
Monday’s 6.1% decline pushed the cryptocurrency decisively below $0.84 daily support. The break confirms bears have seized control of short-term price action.
The Relative Strength Index (RSI) currently reads 40, below the neutral 50 level. This indicates bearish momentum has strengthened following the trendline break.
The Moving Average Convergence Divergence (MACD) also generated a bearish crossover signal Monday. This technical development typically precedes extended downward moves.
Cardano Price Prediction
Bears are targeting the $0.76 support level as their primary downside objective. This level represents a 50% Fibonacci retracement from June’s $0.51 low to August’s $1.02 peak.
The $0.76 area has provided support during previous corrections and represents approximately 6% downside from current levels. A break below this level could accelerate selling toward the $0.65-$0.70 range.
Recovery scenarios require ADA to reclaim the $0.84 level and hold above the broken trendline. However, multiple technical indicators currently favor continued weakness.
The bearish crossover in MACD combined with RSI below 50 suggests downward pressure will persist in the near term. Dormant wallet activity adds fundamental selling pressure to the technical weakness.
ADA faces a challenging period as both technical and on-chain metrics align for lower prices toward the $0.76 support target.
Get 3 Free Stock Ebooks
Discover top-performing stocks in AI, Crypto, and Technology with expert analysis.
- Top 10 AI Stocks - Leading AI companies
- Top 10 Crypto Stocks - Blockchain leaders
- Top 10 Tech Stocks - Tech giants

