
 Price Prediction: Weekly Chart Shows Bull Flag with $5 Target")
TLDR
- Cardano trades near $0.90 with analysts targeting key resistance at $1.15-$1.25
- Bull flag breakout pattern on weekly charts points to $2.47 first target and $5.00 second target
- Weekly close above $1.39 would confirm decisive breakout after two years of consolidation
- Whale accumulation increases as on-chain data shows larger addresses buying during recovery
- Fibonacci extensions and technical patterns align for potential multi-dollar price targets
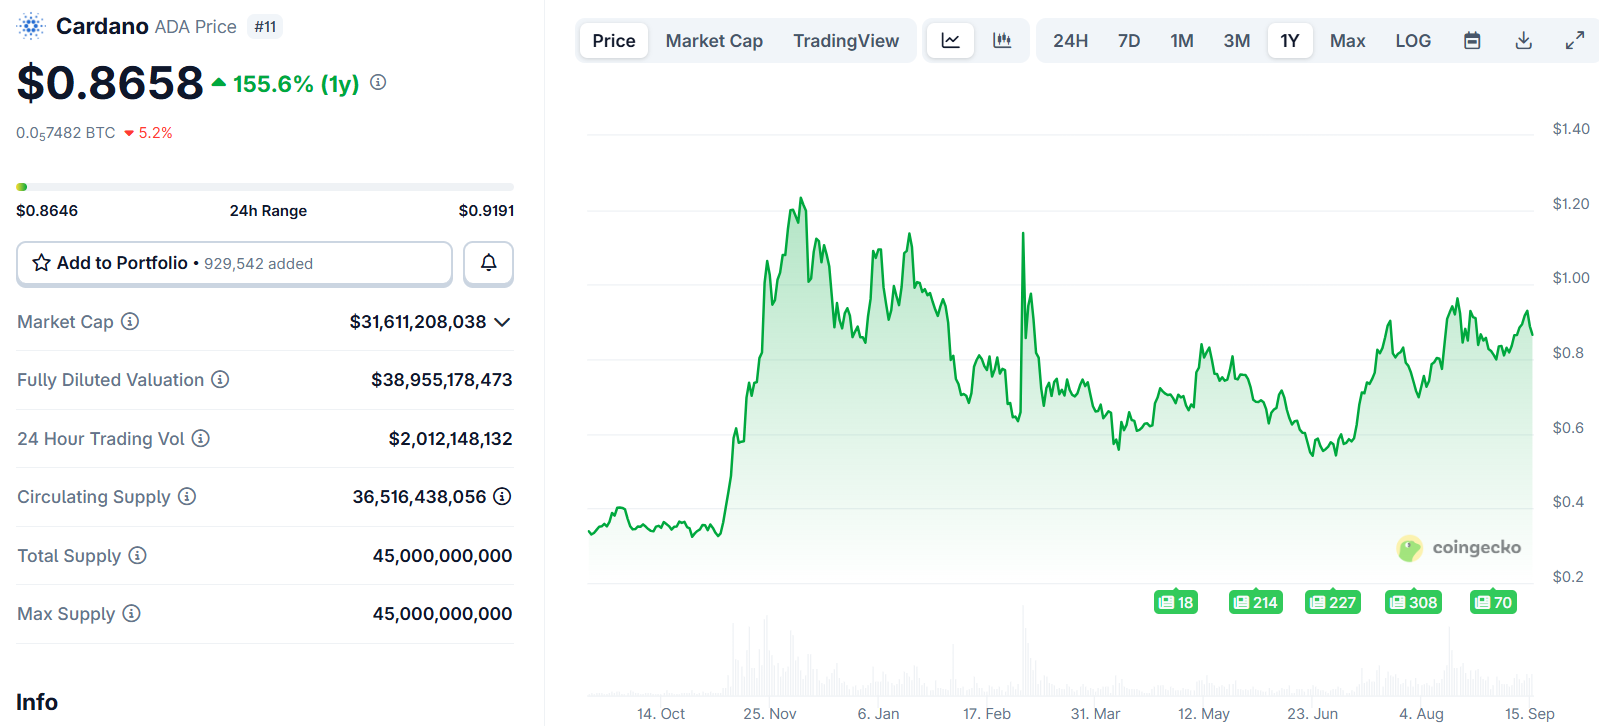
Cardano price analysis reveals multiple bullish technical patterns as the cryptocurrency trades near $0.90. The altcoin has recovered from midsummer lows and approaches critical resistance levels that could determine its next major direction.
Crypto analyst Ali Martinez identifies $1.15 and $1.25 as immediate key targets for ADA. His technical analysis shows Cardano has cleared several near-term obstacles and now faces higher-timeframe resistance zones.
The $1.15 level has historically acted as a recurring ceiling during previous rally attempts. A clean weekly close above this resistance would generate bullish momentum and potentially open pathways toward $1.25-$1.50.
Technical analyst Carl Moon has spotted a bull flag breakout formation on Cardano’s weekly timeframe. This continuation pattern often signals resumption of larger bullish trends when confirmed.
Moon’s analysis indicates that weekly closes above $1.39 would validate the bull flag breakout. The pattern emerged after nearly two years of sideways price consolidation between key support and resistance zones.
Technical Price Targets and Patterns
The bull flag structure presents two primary upside objectives for Cardano price prediction. The first target sits around $2.47, which corresponds with the 0.786 Fibonacci retracement level from previous market cycles.

Successfully breaking above this zone could unlock the second target near $5.00. This represents potential multi-fold returns from current price levels around $0.89.
Other technical analysts point to measured-move calculations and Fibonacci extensions clustering between $1.15 and $1.78. Longer-term scenarios extend into multi-dollar territory if market conditions remain favorable.
The resistance zone between $1.30-$1.40 remains crucial for validating bullish flag patterns. Breaking this area convincingly would reinforce trend reversal likelihood and support higher price objectives.
Chart patterns show Cardano following historical consolidation phases before major moves. The current setup mirrors previous cycles where extended sideways action preceded explosive upward momentum.
On-Chain Data Supports Bullish Outlook
Recent blockchain metrics indicate increased accumulation activity from larger wallet addresses. This whale buying has supported Cardano’s recovery from mid-$0.70s toward current levels near $0.90.
Exchange flow data reveals reduced selling pressure as tokens move away from trading platforms. This pattern typically precedes price appreciation as holders demonstrate diamond hands mentality.
If institutional and whale accumulation continues, available liquidity could decrease during upward moves. This dynamic historically makes breakouts more decisive and sustainable when they occur.
Market indicators present mixed signals with some technical services showing neutral-to-bullish short-term momentum. Sentiment gauges remain cautious, suggesting false breakouts remain possible without proper volume confirmation.
Cardano Price Prediction
Cardano price prediction models suggest the bull case requires holding above $0.94-$0.96 support with rising trading volumes. A confirmed break above $1.15 with follow-through would likely target $1.25 and the $1.50-$1.80 range.
The bearish scenario involves rejection at $1.15 resistance or failure to maintain $0.94 pivot support. This could trigger retracements toward stronger support in the $0.60-$0.80 range based on historical patterns.
Current price action shows ADA just under the psychological $1.00 level on major exchanges. The recovery from summer lows positions Cardano within striking distance of key resistance bands.
Trading volumes will determine whether breakout attempts succeed in reaching ambitious price targets of $2.47 and $5.00 outlined in technical analysis patterns.
Get 3 Free Stock Ebooks
Discover top-performing stocks in AI, Crypto, and Technology with expert analysis.
- Top 10 AI Stocks - Leading AI companies
- Top 10 Crypto Stocks - Blockchain leaders
- Top 10 Tech Stocks - Tech giants

