
 Price Struggles at $0.27 While Manufacturing PMI Signals Potential Reversal")
TLDR
- Cardano is currently hovering around $0.27, testing a critical descending trendline at $0.28 that has consistently rejected upward moves
- Futures open interest has declined to $462 million with the long-to-short ratio at 0.79, indicating prevailing bearish sentiment
- Price action remains significantly below both the 50-day and 100-day EMAs, which cluster above the $0.30 mark
- The Relative Strength Index reads 46, beneath the neutral 50 threshold, reflecting subdued momentum
- Manufacturing PMI has climbed to 52.4%, marking the third straight monthly rise in 40 months—a pattern historically correlated with ADA rallies
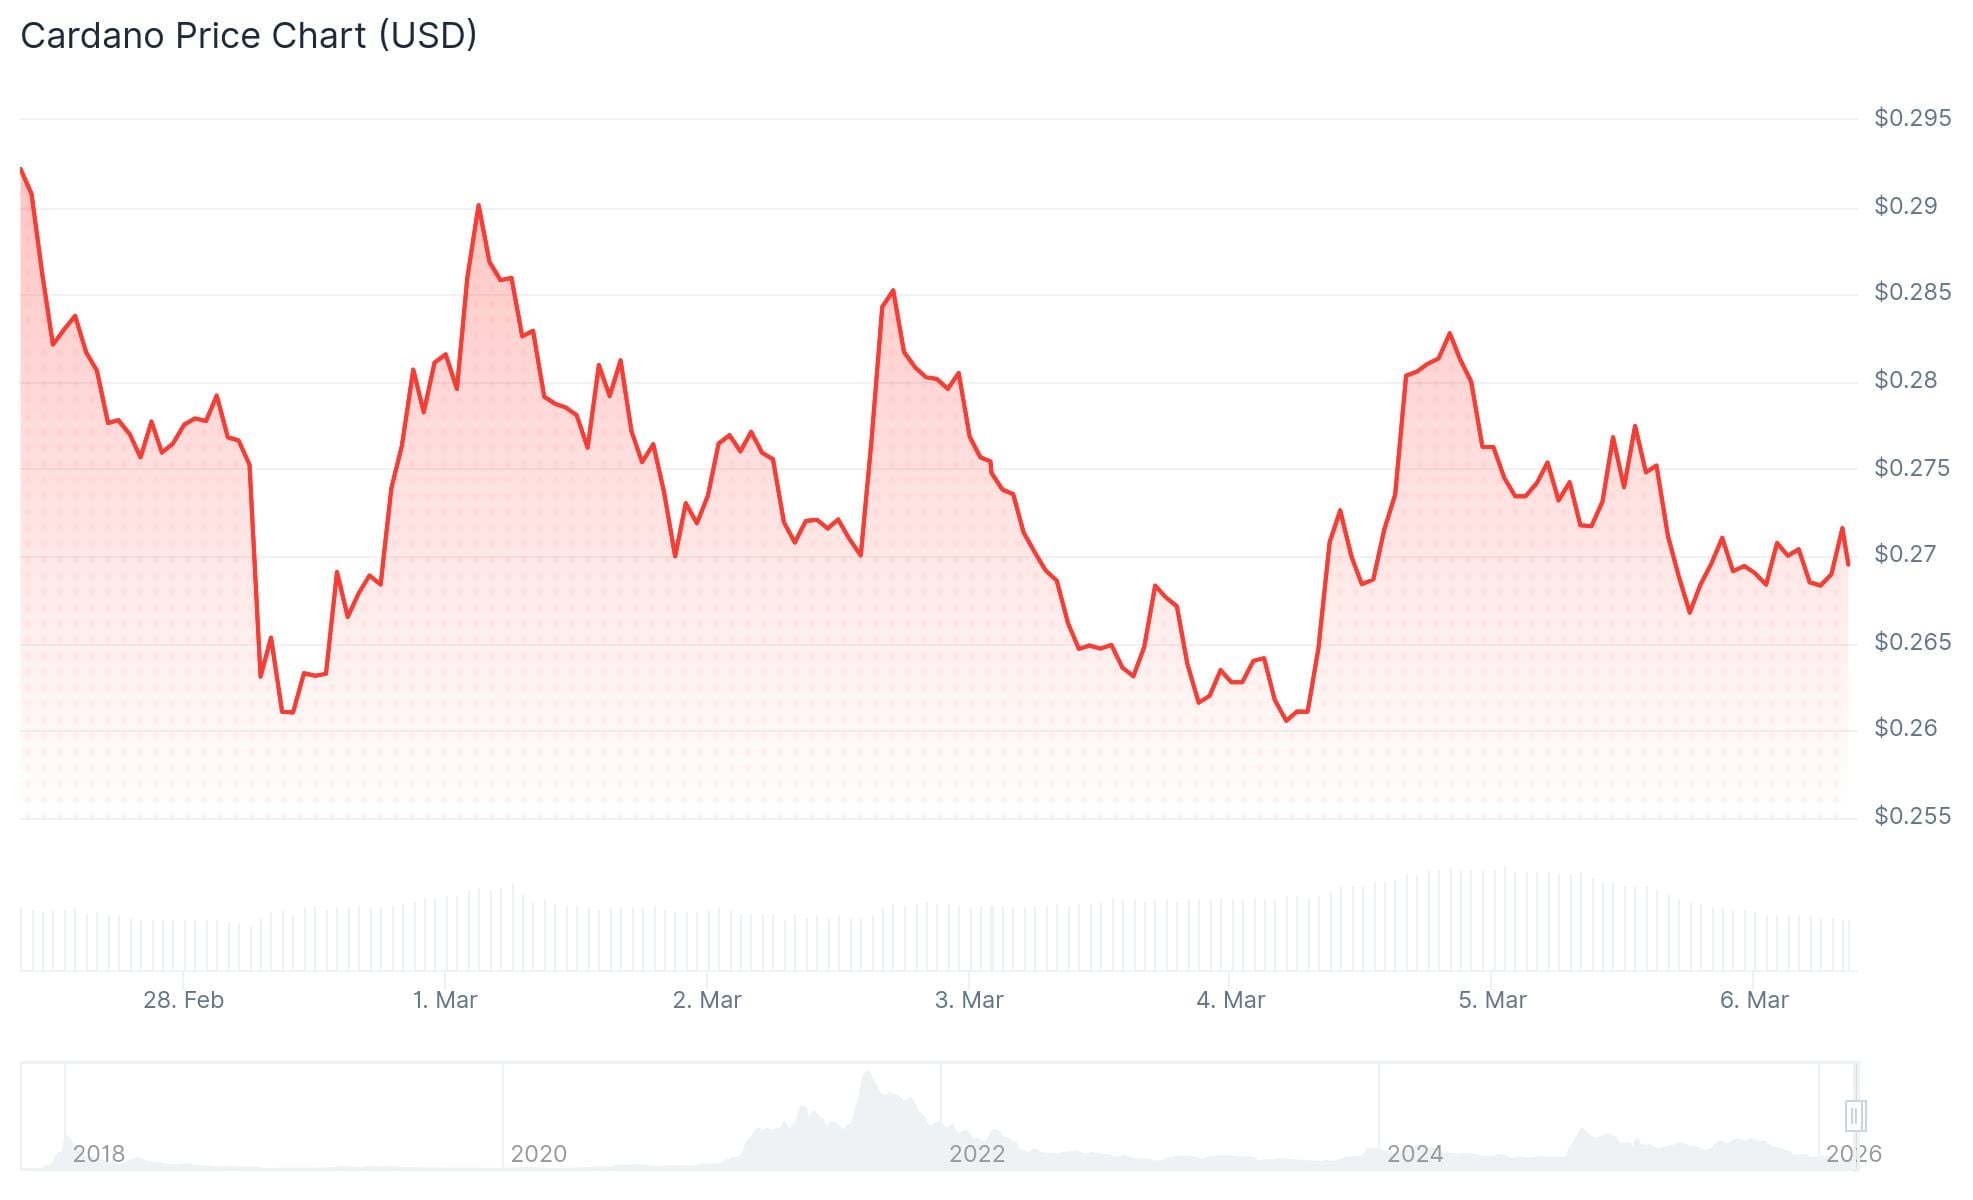
Cardano (ADA) continues to face downward pressure on Thursday, March 6, hovering near the $0.27 level as it tests a crucial descending trendline positioned around $0.28. This technical barrier has previously turned back attempted rallies and remains the primary obstacle for bulls in the near term.
Futures market metrics reinforce the bearish narrative. Open interest for Cardano futures contracts has contracted to $462 million, continuing a downtrend that began in mid-January.
When open interest declines while prices remain stagnant or drift lower, it typically indicates reduced trader engagement and waning market confidence.
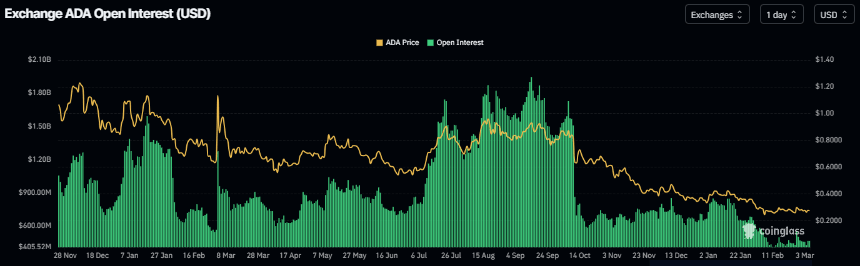
Data from CoinGlass reveals a long-to-short ratio of 0.79, approaching its lowest reading in more than 30 days. This metric suggests short positions outnumber long positions, reflecting widespread expectations for further price weakness.
The token is trading substantially below both its 50-day and 100-day Exponential Moving Averages, which remain clustered above the $0.30 threshold. This distance underscores the prevailing downtrend controlling ADA’s price action.

The daily Relative Strength Index currently registers at 46. Though this represents improvement from oversold conditions, it stays below the critical 50 midpoint, indicating momentum remains lackluster.
Meanwhile, the MACD indicator shows slight positive territory, but the histogram displays minimal movement. This configuration suggests consolidation rather than an emerging directional breakout.
Key Price Levels to Watch
Looking at resistance zones, the immediate hurdle appears at the trendline near $0.28. A more significant barrier awaits at $0.32, where the declining EMAs also intersect.
A sustained daily close above $0.32 would be required to invalidate the current bearish framework and signal potential trend reversal.
On the downside, support is established at $0.26, with a secondary floor at $0.24. Should ADA breach the $0.24 level, additional selling pressure could materialize.
Under present conditions, ADA appears positioned to trade within a $0.26 to $0.29 range unless significant catalysts emerge to drive price beyond these boundaries.
Macro Indicator Points to Possible Shift
While Bitcoin recently climbed above $73,000 to reach a one-month peak, ADA failed to participate meaningfully in the rally. The altcoin registered only minimal gains and couldn’t sustain a close above the prior session’s high.
Crypto analyst Dan Gambardello has highlighted the manufacturing Purchasing Managers Index (PMI) as a significant indicator for Cardano’s medium to long-term trajectory.
The PMI metric, which gauges manufacturing sector vitality, currently registers 52.4%. This marks the third consecutive monthly advance over a 40-month period.
Gambardello observes that previous PMI expansion cycles have historically coincided with bullish phases for ADA price performance.
The present configuration also bears resemblance to the 2019 correction phase, during which ADA recorded negative monthly closes in six out of seven months before staging a substantial recovery.
Quantitative tightening concluded in December 2025. According to Gambardello, this development coupled with an ascending PMI creates a macro environment similar to conditions that preceded Cardano’s previous major price rally.
ADA is currently experiencing its sixth straight monthly decline following a bearish February close.
Get 3 Free Stock Ebooks
Discover top-performing stocks in AI, Crypto, and Technology with expert analysis.
- Top 10 AI Stocks - Leading AI companies
- Top 10 Crypto Stocks - Blockchain leaders
- Top 10 Tech Stocks - Tech giants

