
 Price: Triangle Pattern Nearing Breakout After Year-Long Consolidation")
TLDR
- Cardano is holding above $0.62 support, a key level that lines up with a 0.5 Fibonacci retracement and the base of a year-long triangle pattern
- Technical indicators show momentum may be shifting, with MACD lines narrowing and RSI at 40 in recovery territory
- A breakout above the descending trendline from early October could push ADA toward $0.70 and beyond
- Open interest in ADA futures dropped from $1.8 billion to $648 million, reflecting lower leverage and cautious positioning
- If $0.62 holds, Fibonacci targets suggest potential moves to $0.95, $1.28, and $1.90
Cardano is trading just above $0.62, a price level that has become central to the cryptocurrency’s next move. This support zone matches the 0.5 Fibonacci retracement. It also marks the bottom of a symmetrical triangle pattern that began forming in early 2025.
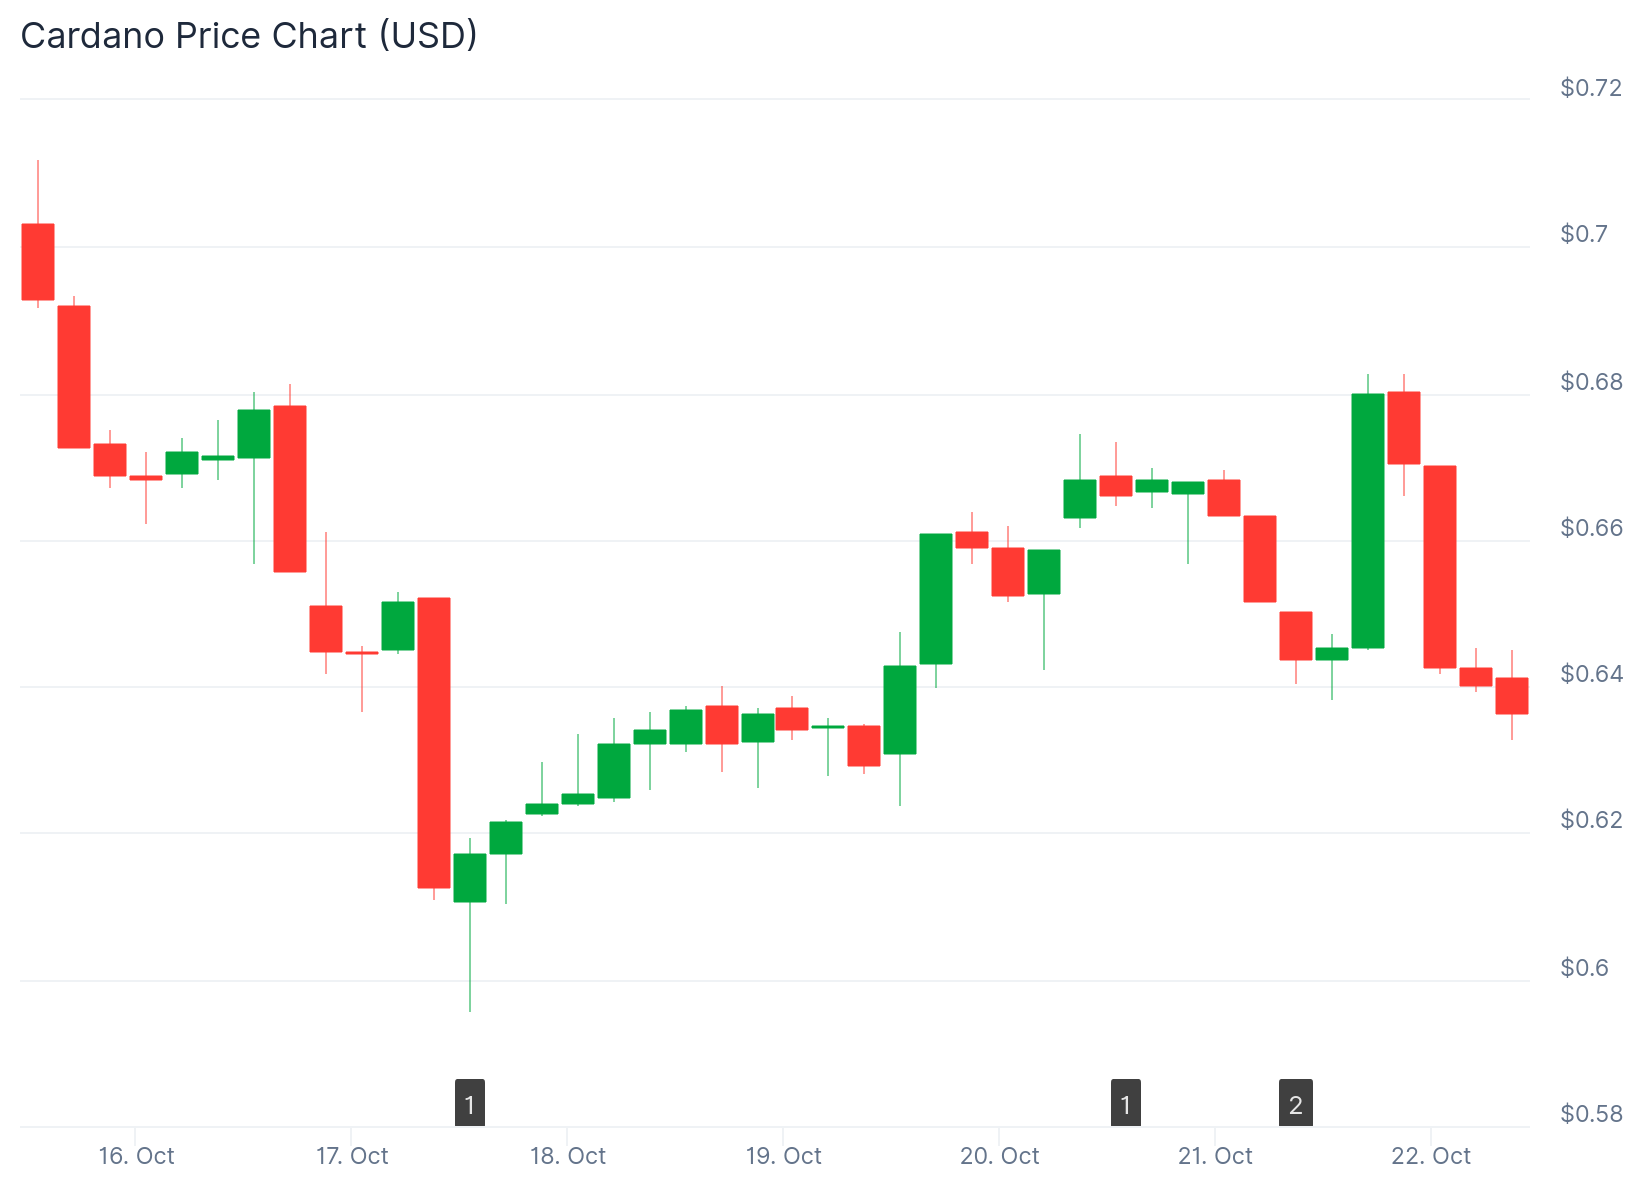
The price currently sits around $0.64. Staying above $0.62 keeps the bullish pattern intact. Falling below this level could invalidate the setup and lead to more selling pressure.
Crypto analyst Ali Charts stressed the importance of this support. Ali stated that $0.62 must hold as support for Cardano to have a real shot at breaking out toward $1.90. The triangle has been compressing for almost a year.
This symmetrical triangle shows price moving between two converging trendlines. These formations often appear before large moves in either direction. With the pattern reaching its narrowest point in late Q4, a breakout looks close.
Triangle Pattern Points to Multiple Price Targets
If the support holds, Fibonacci analysis suggests several upside targets. The first resistance sits near $0.95. Beyond that, levels at $1.28 and $1.86 come into focus.
These are not random price points. They represent areas where past price action showed strong reactions. Traders often watch these levels for signs of momentum shifts.

Analyst Sheldon shared a chart showing ADA approaching a descending trendline. This line has been guiding price action since early October. Sheldon observed that ADA is looking strong and close to the momentum trend.
The cryptocurrency trades within a support band between $0.6245 and $0.6106. This range has been tested multiple times. Each test brought buyers back into the market.
Price is making higher lows within this zone. This suggests demand remains steady at current levels. A clear break above the descending trendline would confirm a return to a short-term uptrend.
Technical Indicators Show Cautious Recovery
The MACD indicator on the daily timeframe shows the MACD line at -0.05. The signal line sits at -0.045. The MACD line is still below the signal line, so no bullish crossover has happened yet.
The gap between these lines is getting smaller. This could signal that momentum is starting to shift. The MACD histogram displays shrinking red bars, which means selling pressure may be easing.
RSI currently reads 40 on the daily chart. This sits below the neutral 50 level. It shows a market still in recovery mode but not yet overbought.
Open Interest Decline Shows Reduced Leverage
Futures open interest for Cardano stands at $648.56 million based on Coinglass data. This marks a sharp drop from over $1.8 billion in mid-September. The decline followed ADA’s move below $0.70.
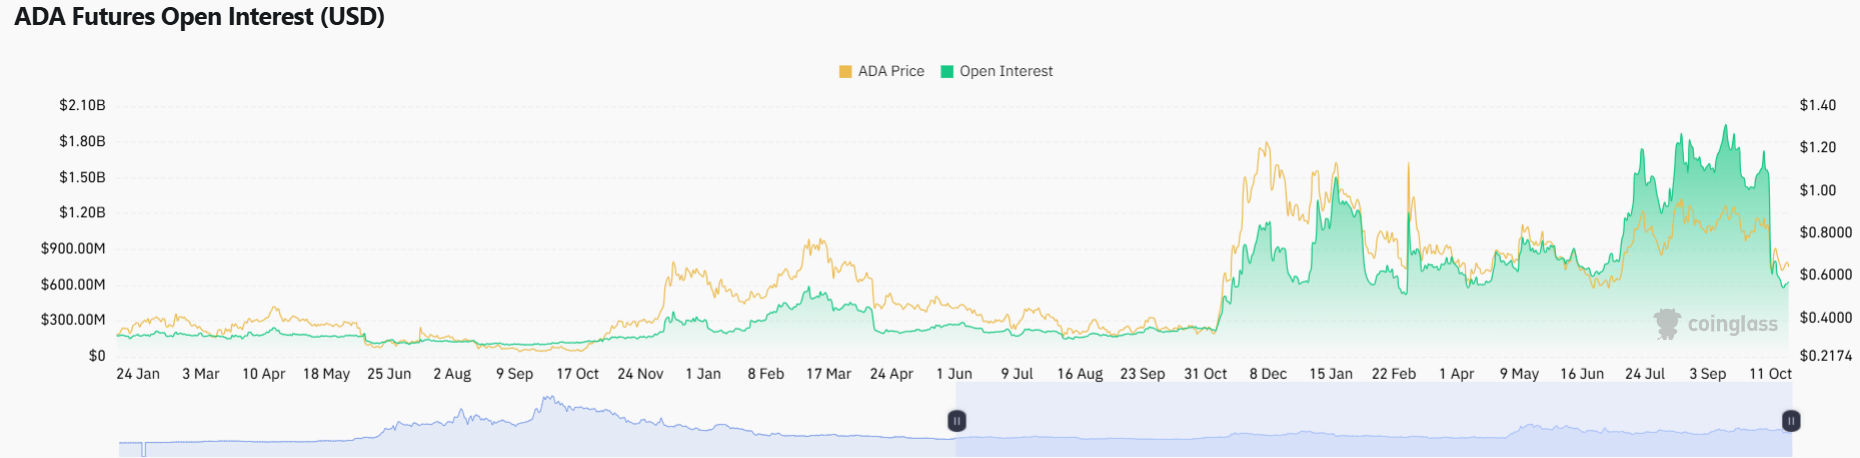
Lower open interest typically means less leverage in the market. It reflects a more cautious approach from traders. In previous market cycles, drops in open interest combined with stable prices have sometimes preceded larger movements.
Traders are monitoring for volume and open interest to pick up again. The reduced leverage could make the market less vulnerable to sudden liquidation events.
Beyond charts, Cardano’s development activity has increased. Work continues on AI applications and identity solutions. The Hydra and Mithril upgrades aim to boost scalability.
Institutional interest has grown since Q3. Larger players appear to be positioning ahead of a potential move. The combination of technical setup and fundamental progress could support a breakout.
The current price of $0.64 leaves little room for error. A sustained close below $0.62 would break the bullish pattern. That could extend consolidation into early 2026 and push prices toward $0.50.
Get 3 Free Stock Ebooks
Discover top-performing stocks in AI, Crypto, and Technology with expert analysis.
- Top 10 AI Stocks - Leading AI companies
- Top 10 Crypto Stocks - Blockchain leaders
- Top 10 Tech Stocks - Tech giants

