
 Under Pressure: Whale Buying Surges Amid Persistent Bearish Indicators")
Key Takeaways
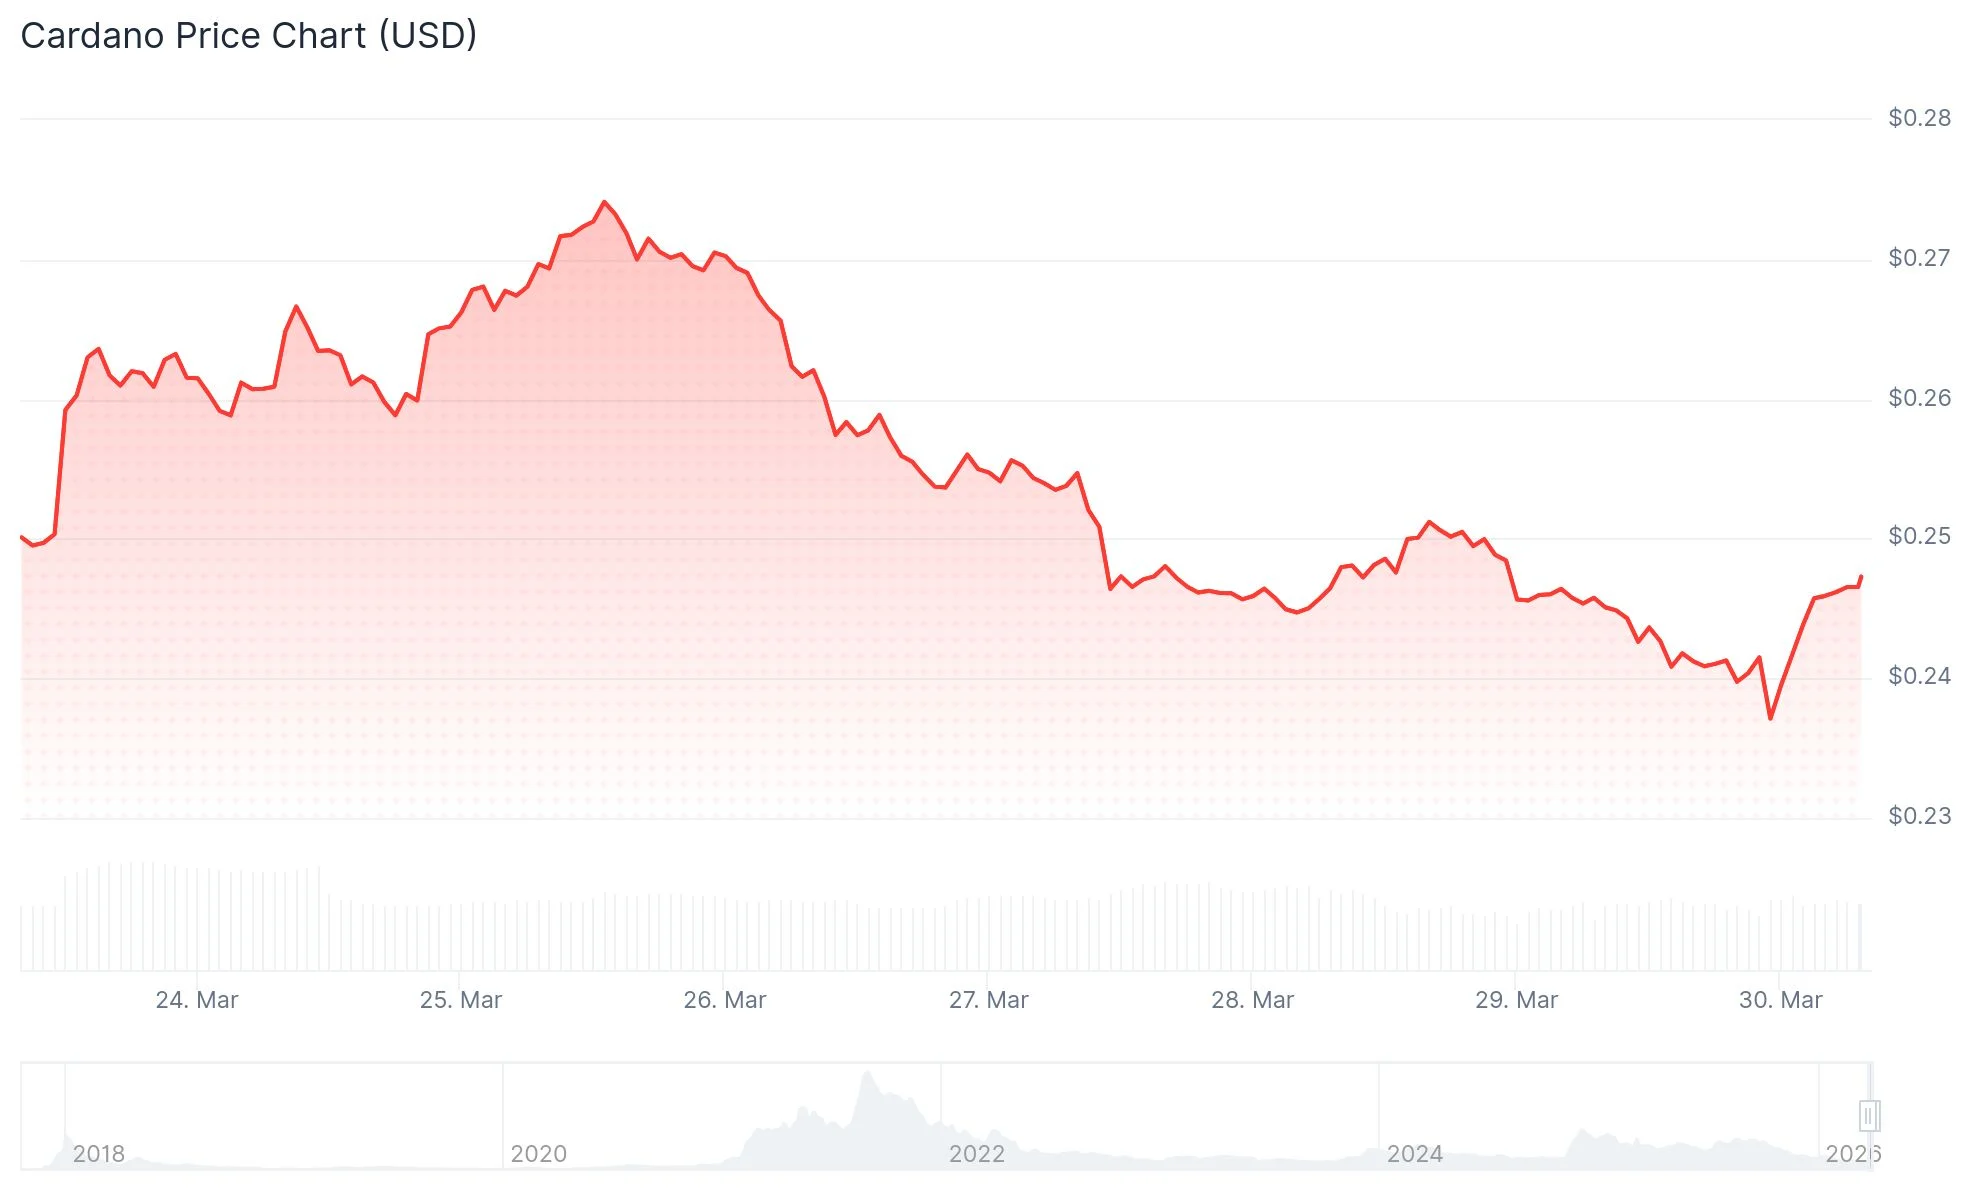
- Cardano trades near $0.24 following a fortnight of downward pressure
- Major holders accumulated 230 million ADA tokens during the five-day period ending Monday
- Long-to-short positioning stands at 1.14, indicating bullish bias among derivatives traders
- Price action remains beneath critical moving averages with RSI reading 41, reflecting subdued momentum
- Technical analyst Ali Charts identified a channel breakdown suggesting potential slide toward $0.22
Cardano (ADA) is hovering near the $0.24 mark as Monday’s session unfolds, posting a modest rebound following two consecutive weeks of declining prices. The digital asset has shed over 4% in the past seven days, with technical metrics continuing to flash warning signals.
While price performance remains lackluster, blockchain analytics reveal intriguing activity among large-scale holders. Santiment tracking data indicates that whale cohorts managing between 100,000 and 1 million ADA, alongside those controlling 10 million to 100 million tokens, collectively acquired 230 million ADA during the Wednesday through Monday timeframe.
%20%5B08-1774842903642-1774842903642.18.27%2C%2030%20Mar%2C%202026%5D.png&w=1536&q=95)
The accumulation pattern wasn’t universal across all whale segments, though. Address clusters holding 1 million to 10 million ADA offloaded approximately 30 million tokens during this identical window, suggesting potential surrender from this particular investor group.
Examining derivatives markets, CoinGlass metrics reveal ADA’s long-to-short ratio reaching 1.14, marking its most elevated reading in more than 30 days. When this ratio exceeds 1, it demonstrates that traders opening long positions outnumber those betting on price declines.
CryptoQuant intelligence similarly paints a largely balanced market environment with marginal bullish undertones, displaying substantial whale activity across both spot exchanges and futures platforms.

Chart Analysis Reveals Ongoing Weakness
Regardless of these accumulation patterns, technical analysis presents a more conservative outlook. Cardano currently trades beneath both its 50-day and 100-day exponential moving averages, with both indicators sloping downward.
The Relative Strength Index registers at 41, indicating diminished momentum while remaining above deeply oversold conditions. The MACD indicator has retreated below both its signal line and the neutral zero threshold, with histogram bars displaying intensifying bearish pressure.
Near-term price support emerges at $0.23. Should this floor fail, Cardano could descend toward the $0.22 level. Looking upward, resistance materializes at $0.26, followed by a more substantial barrier positioned around $0.29.
Market Observer Highlights Price Pattern Violation
Cryptocurrency market commentator Ali Charts shared via X that Cardano has violated its established price channel pattern, with this technical development creating conditions for a potential move toward $0.22. This observation, published approximately 12 hours prior, corresponds with the broader bearish configuration evident across numerous technical instruments.
ADA reached a support boundary near $0.237 after encountering resistance at $0.275 during the week’s earlier trading. The Chaikin Money Flow metric has plunged significantly into negative readings, indicating capital withdrawal from the asset.
Continuous pressure against the $0.23 to $0.24 support region is progressively undermining its strength. Should this zone ultimately fail, the subsequent significant support level appears at $0.20.
Get 3 Free Stock Ebooks
Discover top-performing stocks in AI, Crypto, and Technology with expert analysis.
- Top 10 AI Stocks - Leading AI companies
- Top 10 Crypto Stocks - Blockchain leaders
- Top 10 Tech Stocks - Tech giants

