
 Price: Triangle Pattern Breakout Could Trigger Rally to $100")
TLDR
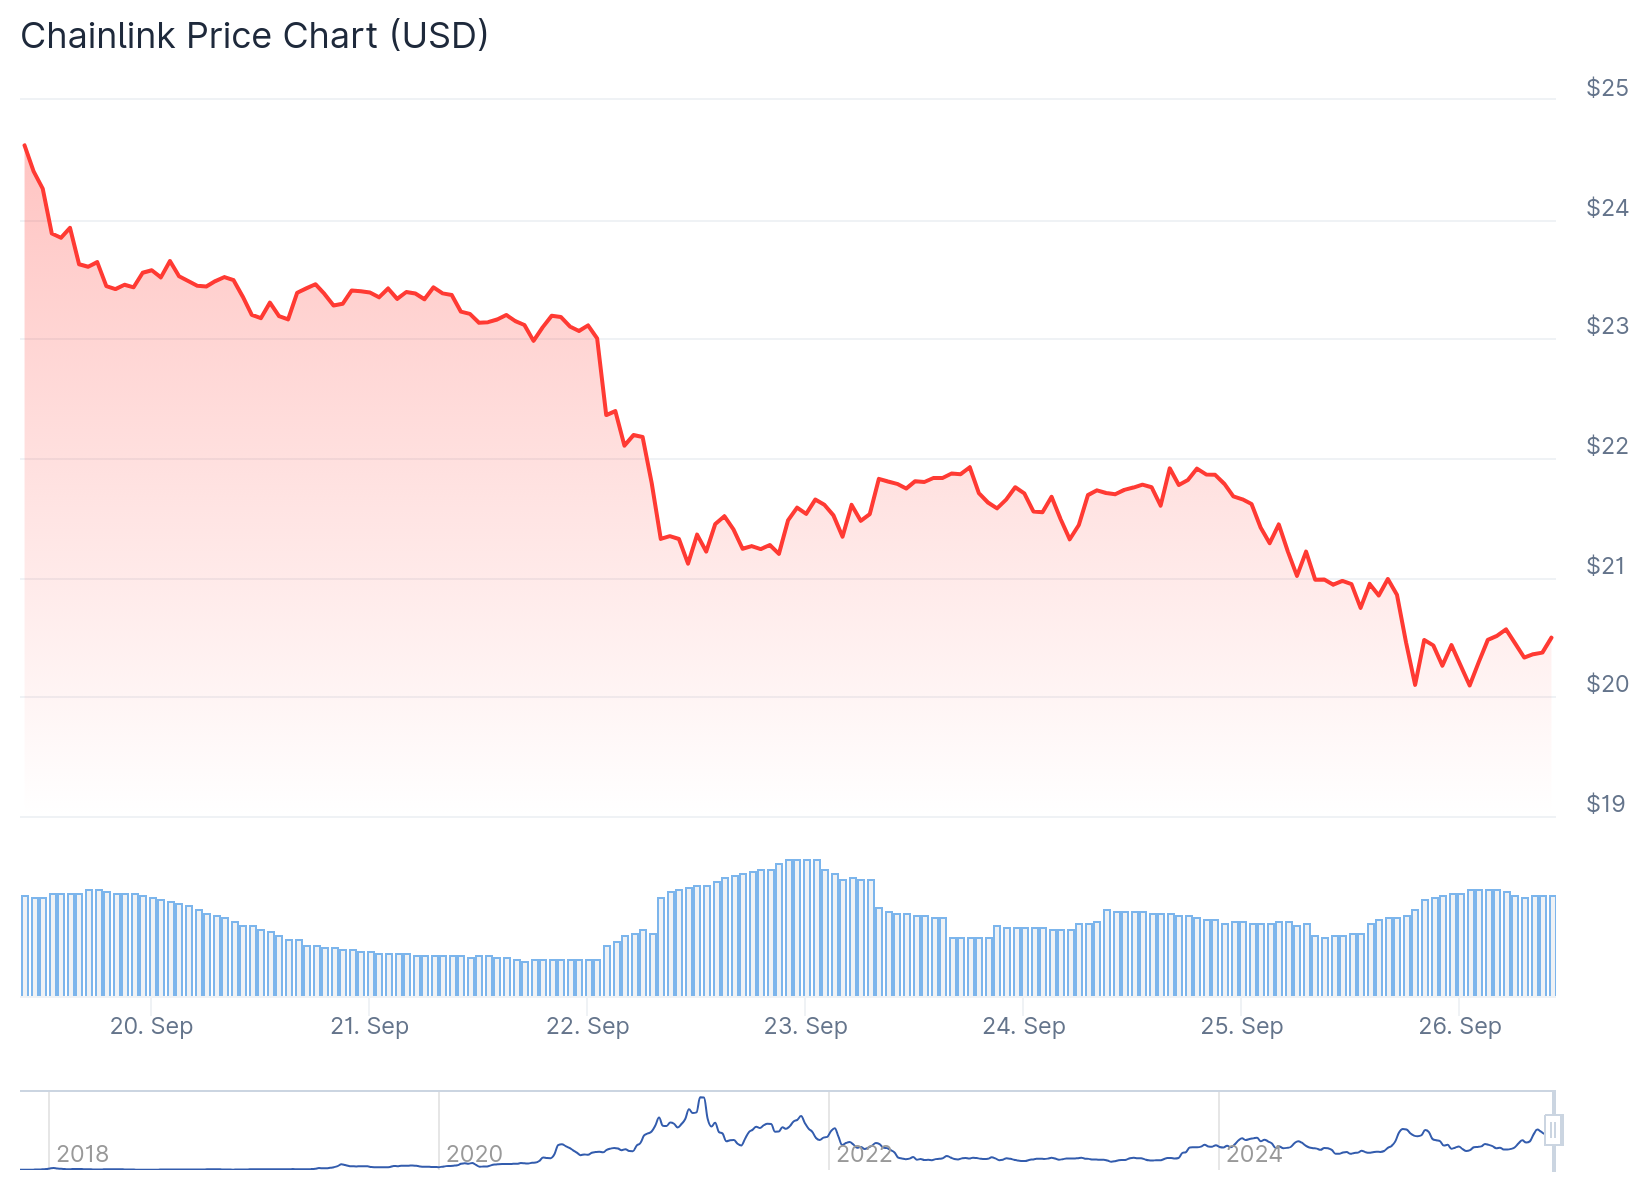
- Chainlink trades at $21.77 with key resistance at $22.00 level
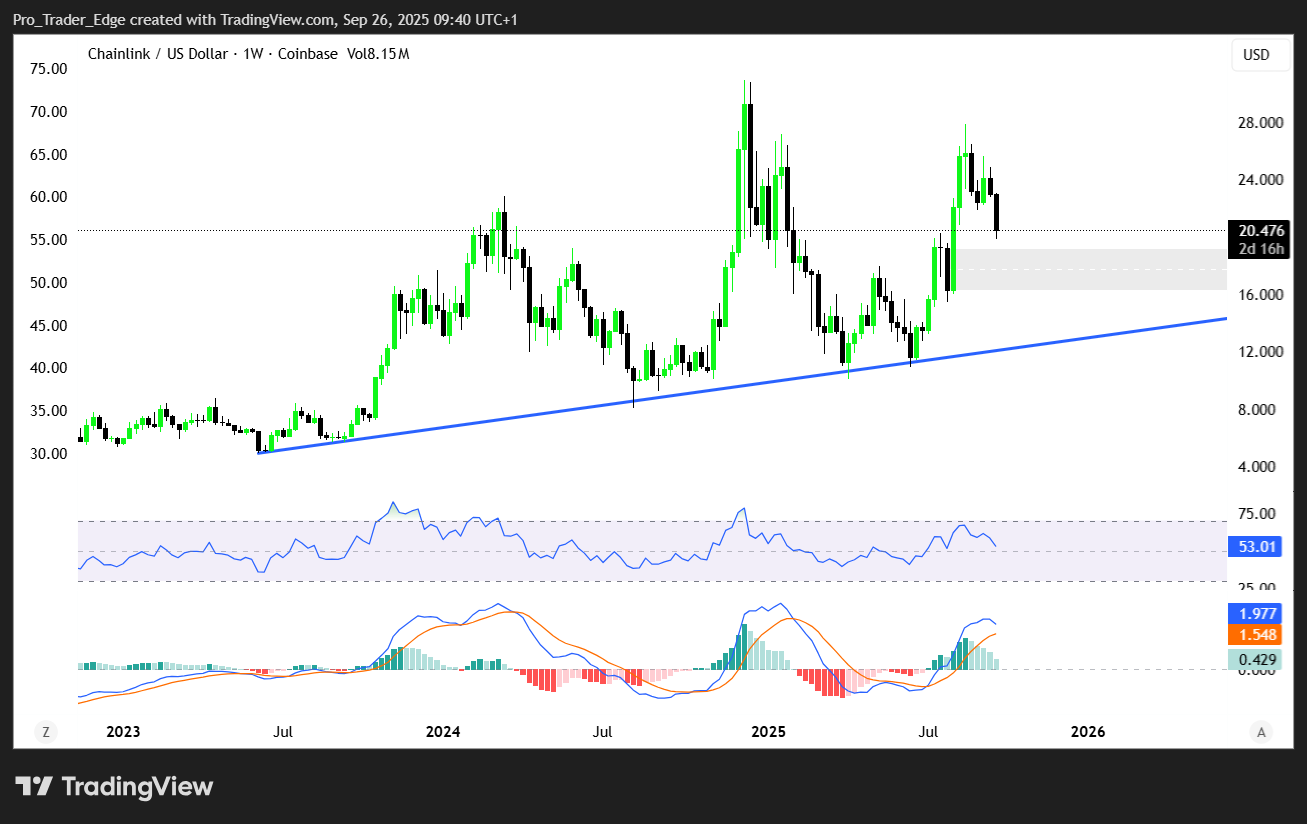
- Multi-year triangle pattern suggests potential breakout to $100 price target
- Fibonacci support at $16 could provide strong buying opportunity
- Daily trading volume remains healthy at $839 million despite recent weakness
- Long-term diagonal resistance since 2021 continues limiting upward moves
Chainlink price action shows the cryptocurrency testing critical levels as technical analysts identify a multi-year triangle pattern that could drive significant price movement. The digital asset currently trades around $21.77, with the $22.00 resistance level serving as a key battleground.
Technical analyst Ali Martinez has highlighted a triangle consolidation pattern forming over several years in Chainlink’s weekly chart. This pattern combines elements of both symmetrical and ascending triangles, creating converging trendlines that have contained price action.
The triangle pattern shows Chainlink has been consolidating within defined boundaries. Earlier this year, the cryptocurrency attempted to break above the upper trendline but faced rejection, leading to the current downward movement toward lower support levels.
Martinez suggests that a decline to $16 would present an attractive buying opportunity. This price level aligns with the 0.5 Fibonacci retracement level, historically a strong support zone for Chainlink price movements.
Fibonacci Analysis Points to $100 Target
The technical setup indicates that a bounce from the $16 Fibonacci level could trigger a triangle breakout. Such a breakout would target the 1.272 Fibonacci extension level, translating to approximately $100 in price terms.
Current market dynamics show Chainlink facing immediate resistance at $22.00. Crypto analyst Crypto Monkey notes that rejection at this level could create selling opportunities toward the $20.00 support zone.

However, a confirmed breakout above $22.00 could attract fresh buying interest. This would potentially open pathways toward the $26.00 level and eventually the longer-term $31 target.
Trading volume remains robust at approximately $839 million, indicating sustained market participation despite recent price declines. The strong volume suggests genuine market interest rather than thin liquidity conditions.
Long-Term Resistance Challenges
MarketMaestro has identified a long-term red diagonal resistance line on monthly charts that continues constraining Chainlink price advances. This trendline has successfully blocked multiple breakout attempts since the 2021 market peak.
Recent price action confirms this resistance remains active, with selling pressure emerging at higher levels. Key support zones have been identified at $14, $17, $21, and $25 as potential demand areas if downward pressure continues.
The $21.30 to $21.40 range now serves as immediate support following recent trading sessions. Daily charts show Chainlink opened near $21.60 before retreating to $21.37, marking a 1.35% daily decline.
Despite current headwinds, the $31 zone remains a major target if market conditions improve. A decisive monthly close above the diagonal resistance could shift sentiment and enable moves toward higher Fibonacci extension levels.
Chainlink maintains its position as the 13th largest cryptocurrency with a market capitalization of approximately $14.48 billion and circulating supply near 678 million tokens.
Get 3 Free Stock Ebooks
Discover top-performing stocks in AI, Crypto, and Technology with expert analysis.
- Top 10 AI Stocks - Leading AI companies
- Top 10 Crypto Stocks - Blockchain leaders
- Top 10 Tech Stocks - Tech giants

