

TLDR
- Chainlink price bounced from $16 support level, a zone that has triggered multiple recoveries
- Large holders purchased 54 million LINK tokens near $16, strengthening support
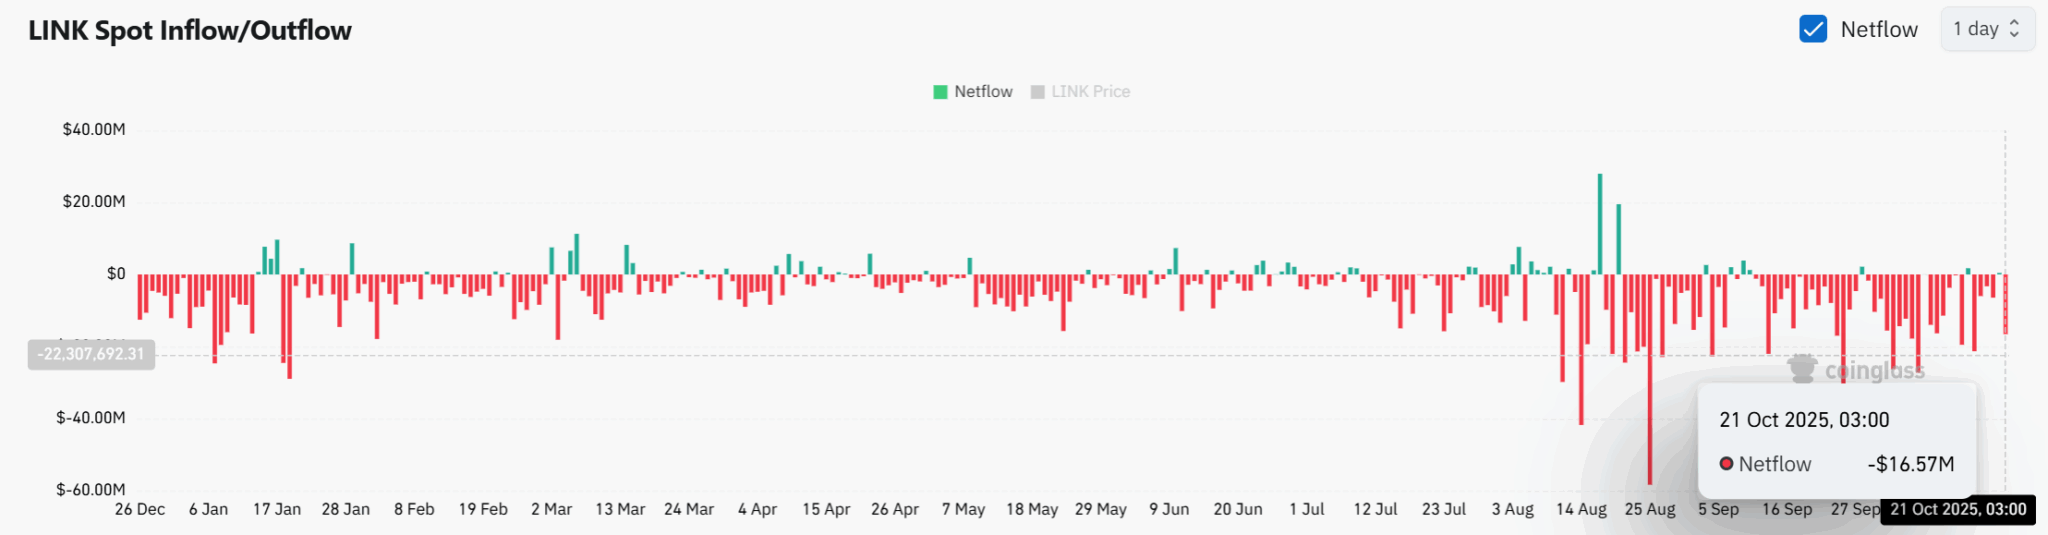
- Net outflows from exchanges reached $16.57 million on October 21, reducing available supply
- LINK trades in a multi-year symmetrical triangle pattern that started in 2022
- Breakout above $19.95 resistance could push price toward $27 by December
Chainlink price has rebounded from the $16 support level, continuing a pattern that has repeated multiple times. The token trades within a descending channel on daily charts.
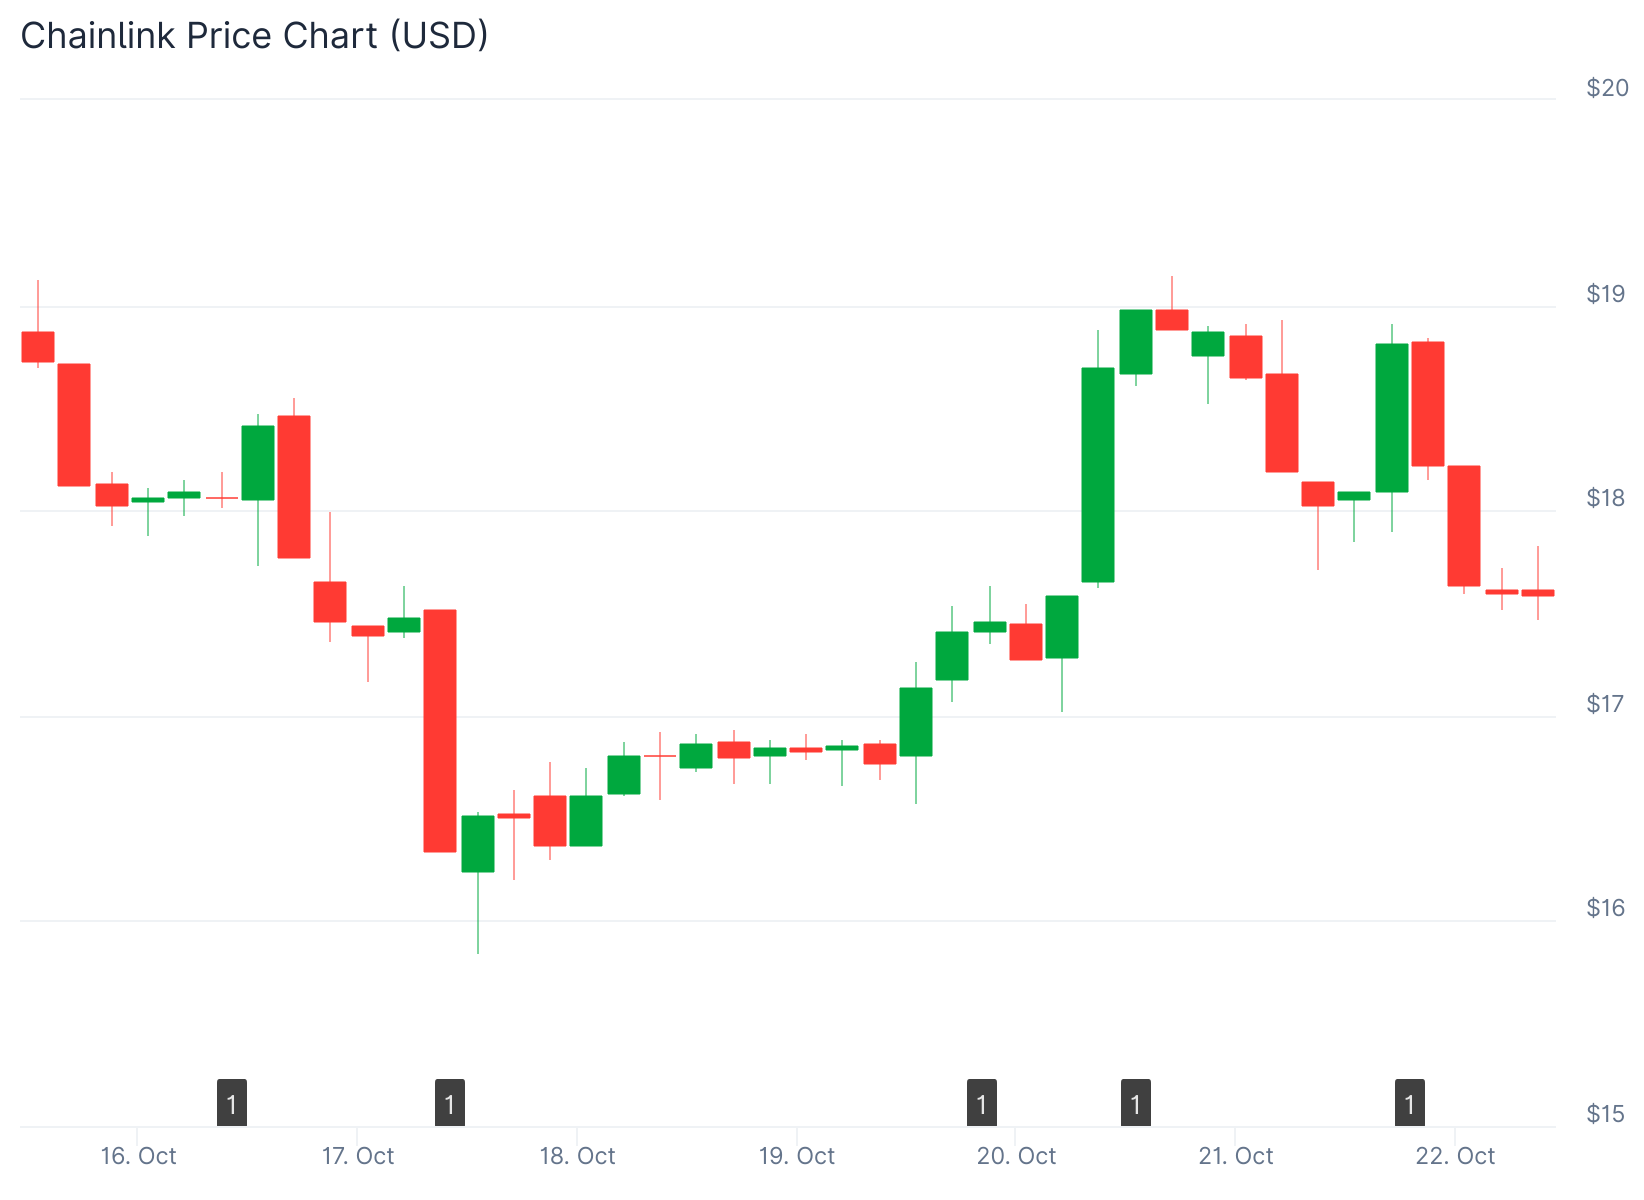
The $16 zone keeps attracting buyers. This level has proven to be a reliable accumulation area for investors.
Large holders have purchased approximately 54.47 million LINK tokens around the $16 price point. Blockchain data confirms this buying activity strengthens the support zone.
When whales buy at specific levels, it often signals price reversals. The volume of tokens accumulated at $16 shows strong conviction from major holders.
Exchange data reveals declining supply on trading platforms. On October 21, LINK recorded net outflows of $16.57 million.
This represents one of the largest single-day withdrawals in recent weeks. Tokens moving off exchanges typically reduces selling pressure.

Lower supply on exchanges creates conditions for price increases. Fewer tokens available for immediate sale can lead to upward movements.
Technical Analysis Points to Breakout Potential
Chainlink price faces immediate resistance at $19.95. This level has controlled previous rallies.
Breaking through $19.95 has historically led to quick price gains. An analyst identified a symmetrical triangle pattern that began in 2022.
The pattern shows converging trendlines as the price range narrows. These formations typically resolve with breakouts as the triangle apex approaches.
A move above $19.95 could lead to a test of $23.6. Continued momentum might push LINK toward $27 by December.
The formation of higher lows supports the bullish case. Each pullback has found support at progressively higher levels.
Multi-Year Pattern Nears Critical Level
The triangle pattern on LINK charts falls between an ascending and symmetrical triangle. The token tested the upper boundary earlier this year but was rejected.
Price has declined since that rejection. The chart shows LINK approaching the end of this multi-year consolidation.
Breakouts become more probable as price ranges tighten. The current narrow trading range suggests a breakout may be near.
Moves above triangle patterns tend to be bullish. Breaks below the pattern typically trigger selling.
If LINK breaks above resistance near $25, analysts see potential for a strong rally. One technical target sits at the 1.272 Fibonacci Extension level around $100.
The $16 support zone continues to hold as the foundation for recovery. Whale buying at this level reinforces its importance.
Exchange outflows confirm reduced selling pressure. The combination of strong support and declining exchange supply creates favorable conditions.
The symmetrical triangle pattern shows LINK consolidating after years of price movement. A breakout above key resistance levels could trigger the next major move.
Technical indicators and on-chain data align to support the bullish case. LINK trades at $17.56 as whales continue accumulating tokens off exchanges.
Get 3 Free Stock Ebooks
Discover top-performing stocks in AI, Crypto, and Technology with expert analysis.
- Top 10 AI Stocks - Leading AI companies
- Top 10 Crypto Stocks - Blockchain leaders
- Top 10 Tech Stocks - Tech giants

