
 Compresses Into Falling Wedge as Bulls Watch Key Levels")
Key Takeaways
- A falling wedge formation is developing on DOGE’s daily chart, a pattern often associated with explosive breakouts.
- Critical resistance levels are clustered between $0.105 and $0.11, coinciding with important Fibonacci zones.
- The Relative Strength Index has climbed from oversold conditions toward neutral territory, showing early bullish hints.
- A decisive reclaim of the 50-day EMA would mark the first legitimate indication of trend reversal.
- As of March 18, DOGE exchanged hands around $0.094, reflecting a roughly 5% decline over the previous 24-hour period.
Dogecoin continues to consolidate around the $0.10 mark, squeezing into a technical formation that has captured trader interest across crypto markets. While historical precedent suggests potential volatility ahead, the immediate outlook remains murky.
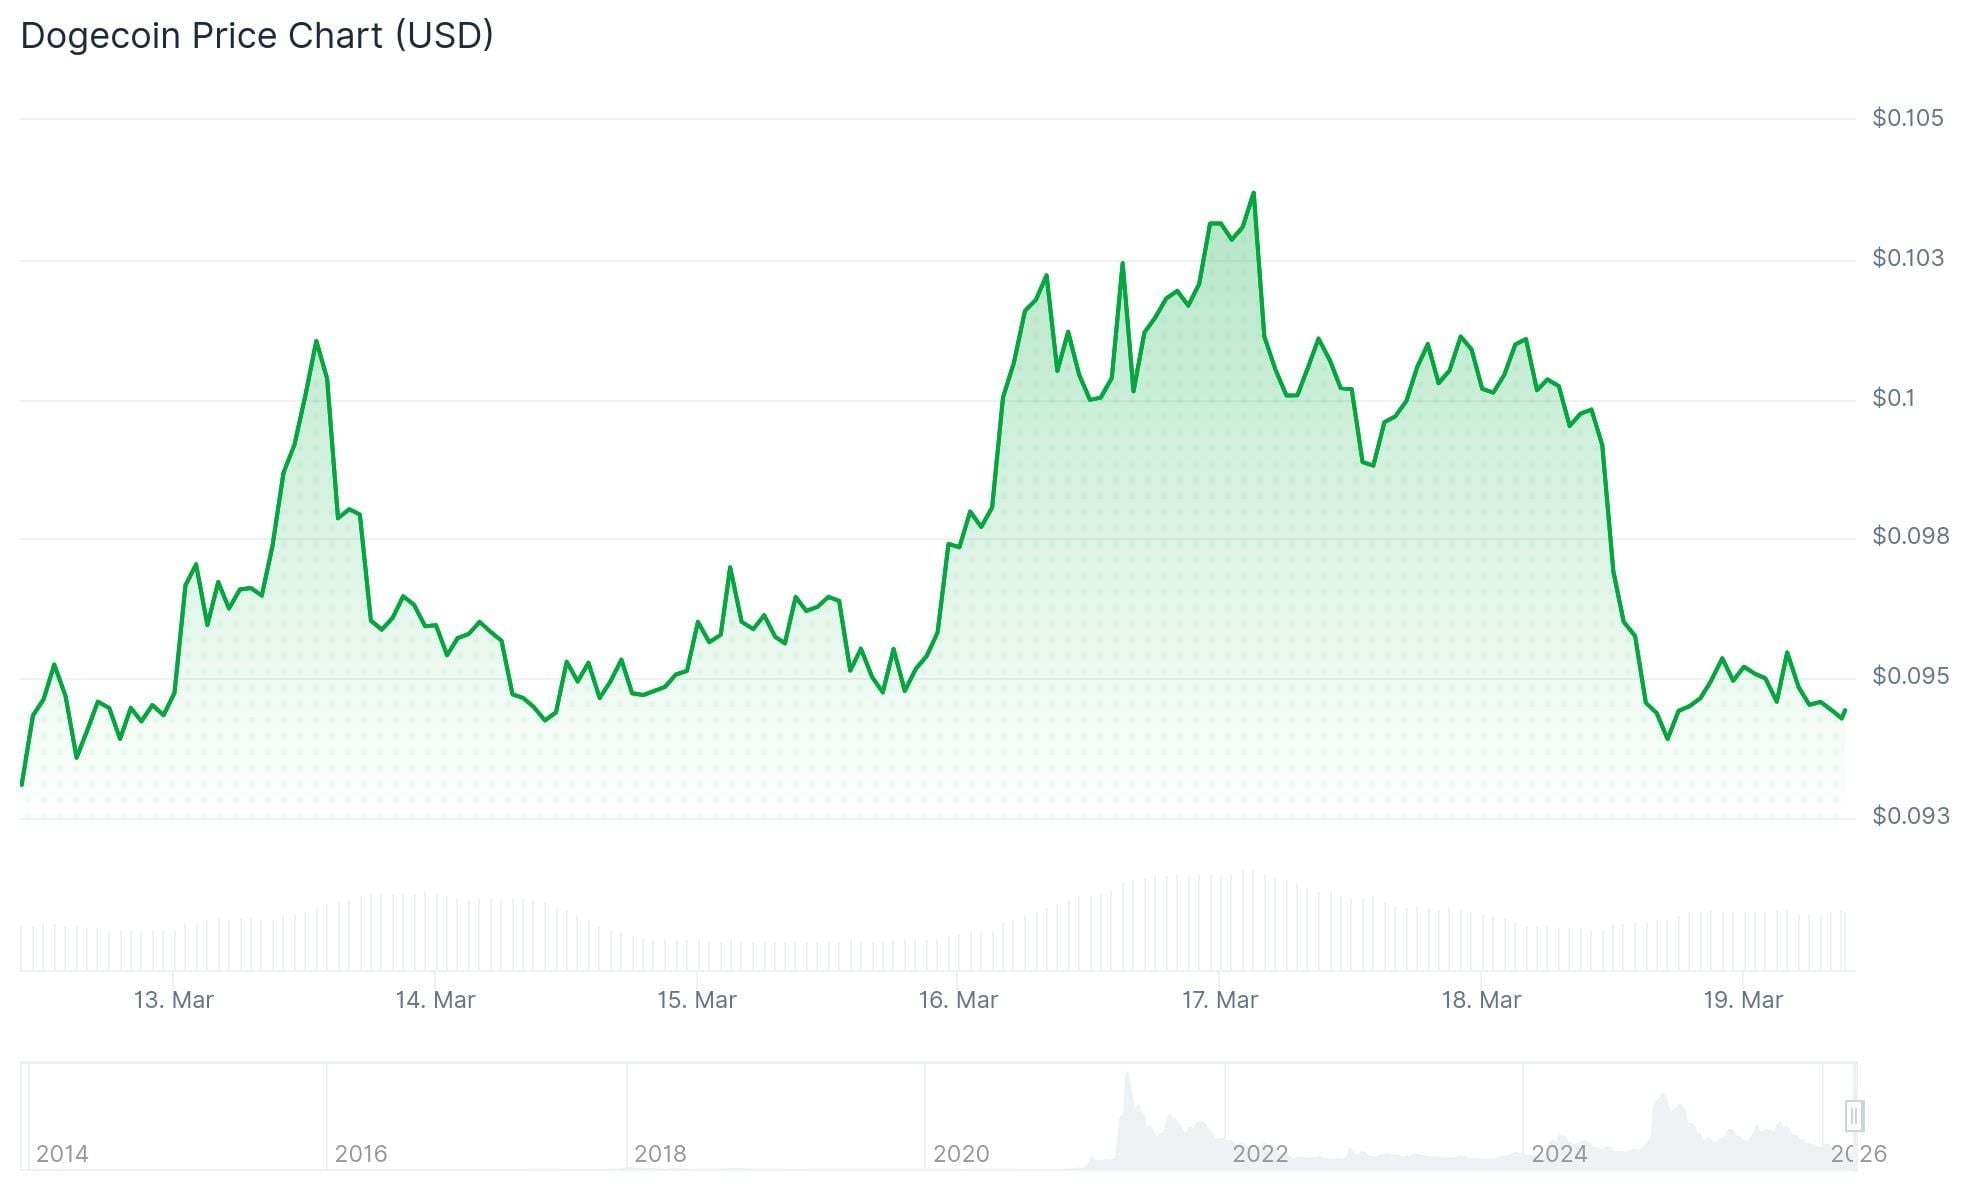
Chart observers have identified a developing falling wedge on DOGE’s daily timeframe. This configuration occurs when an asset prints declining peaks while simultaneously establishing higher troughs, creating a narrowing price channel. Once this consolidation reaches a critical point, breakouts frequently materialize. Market participants who weathered the recent decline are anticipating an upside resolution.
This compression phase emerged following a corrective wave that unwound earlier bullish momentum. Throughout this period, Dogecoin has demonstrated diminishing selling intensity alongside progressively lower peaks, indicating potential exhaustion among bears.
Near-Term Barriers Remain Intact
The immediate obstacle confronting any bullish revival sits between $0.105 and $0.11. This zone aligns precisely with the 0.5 through 0.618 Fibonacci retracement measurements derived from the latest downturn. Additionally, multiple short-term exponential moving averages converge within this territory, creating a formidable resistance cluster.
The $0.10 threshold has been challenged numerous times throughout the past twelve months. Previous attempts to establish ground above this level consistently attracted renewed selling pressure. Market technicians note this repetitive rejection has compromised $0.10’s effectiveness as dependable floor support.

Should DOGE manage a convincing breach above $0.11, the pathway toward $0.116 and subsequently $0.136 would activate. However, prices currently remain beneath the 50-, 100-, and 200-day moving average structures, preserving the dominant bearish framework.
March 18 trading activity saw DOGE hovering near $0.094, representing a 4.84% intraday pullback.
50-Day Moving Average Presents Major Obstacle
Assuming DOGE successfully penetrates the $0.11 barrier, the 50-day exponential moving average looms immediately overhead and has shadowed the downtrend throughout the entire correction cycle. This dynamic indicator continuously recalibrates alongside price action, creating challenges for maintaining any breakout momentum.
Historical price behavior demonstrates that recapturing the 50-day EMA typically serves as the initial reliable signal that DOGE’s directional bias is transforming. Absent this technical confirmation, market analysts categorize any advance beyond $0.10 as temporary relief rather than genuine trend reversal.
The RSI indicator has rebounded from oversold readings and currently hovers around the neutral 50 level with modest bullish character. The MACD histogram similarly approaches a constructive crossover event, signaling that bearish momentum may be fading.
Current market data confirms DOGE maintains position above its longer-duration support foundation near $0.086, which established the most recent local bottom preceding the present recovery attempt.
Get 3 Free Stock Ebooks
Discover top-performing stocks in AI, Crypto, and Technology with expert analysis.
- Top 10 AI Stocks - Leading AI companies
- Top 10 Crypto Stocks - Blockchain leaders
- Top 10 Tech Stocks - Tech giants

