
 Price: $23 Million in Exchange Outflows Signal Accumulation")
TLDR
- Dogecoin trades at $0.24 as technical analysis reveals potential transition from consolidation to parabolic growth phase
- $23 million worth of DOGE moved off exchanges, indicating whale accumulation and decreasing selling pressure
- 21Shares Dogecoin ETF added to DTCC platform, reflecting institutional interest in meme coin investment products
- Short-term resistance levels at $0.2540 and $0.2550 are limiting immediate upward movement
- Long-term projections point toward $1 target if current chart patterns continue through 2025
Dogecoin price sits at approximately $0.24 as the cryptocurrency enters what analysts describe as a pivotal moment. On-chain data combined with technical analysis suggests the meme coin may be preparing for its next major move.
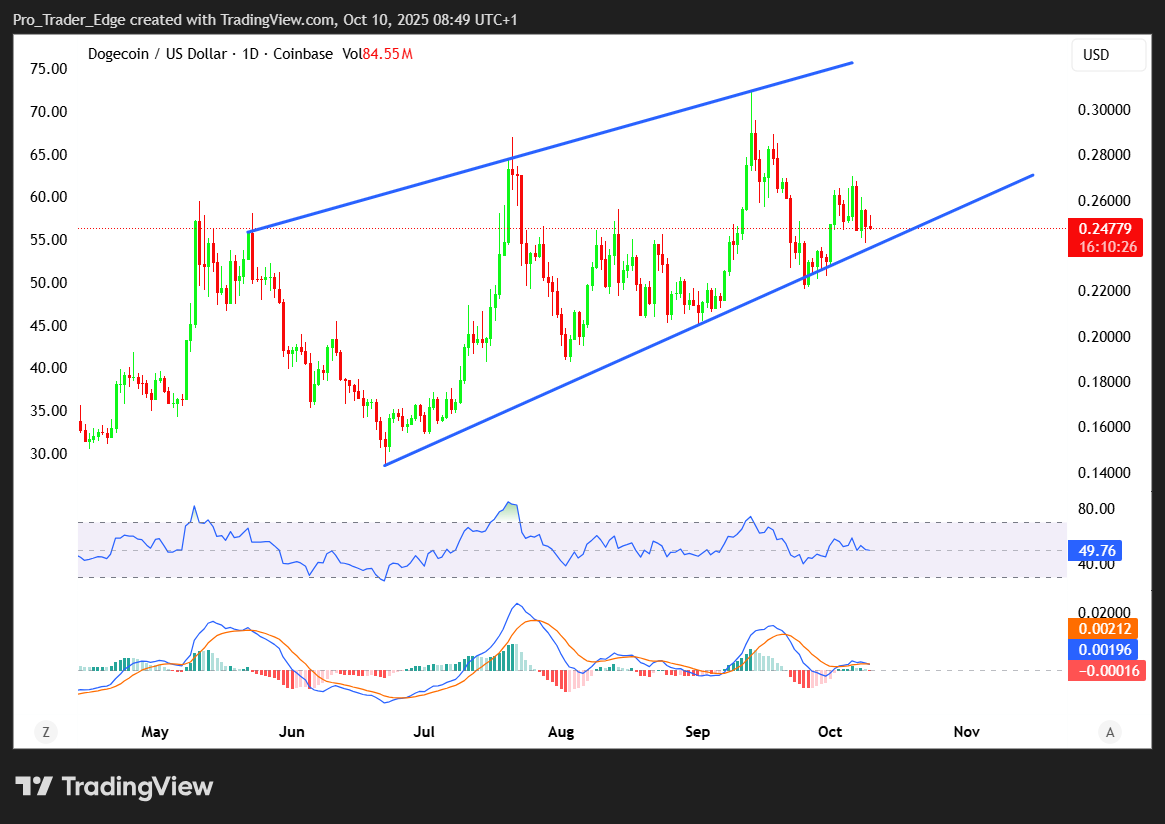
A crypto analyst recently examined Dogecoin’s long-term price structure. The analysis shows the coin progressed through multiple phases since 2023. From mid-2022 to late 2023, Dogecoin remained in a consolidation period with limited volatility.
The coin entered a slow-bull phase throughout 2024. The weekly chart displays gradual higher lows forming during this time. By mid-2025, early indicators of exponential growth began appearing in the price structure.
The current weekly chart pattern resembles previous cycles that preceded major breakouts. Analysts suggest this setup could push Dogecoin toward the $1 level over the next year if the pattern holds.
Whale Movement and Supply Dynamics
Recent data from CoinGlass shows $23 million in Dogecoin leaving cryptocurrency exchanges. These outflows typically signal accumulation rather than distribution among large holders.
When combined with stable on-chain metrics, exchange outflows suggest whales are positioning for potential upward movement. This behavior matches patterns seen before previous meme coin rallies led by Dogecoin.

Reduced exchange reserves limit the immediate supply available for trading. This dynamic can create stronger price reactions when buying demand increases. The timing aligns with recent institutional developments in the Dogecoin market.
The 21Shares DOGE ETF recently received listing on the DTCC platform. This development provides institutional and traditional investors with regulated access to Dogecoin exposure. The ETF listing indicates growing acceptance of meme coin investment products.
Current Price Levels and Technical Outlook
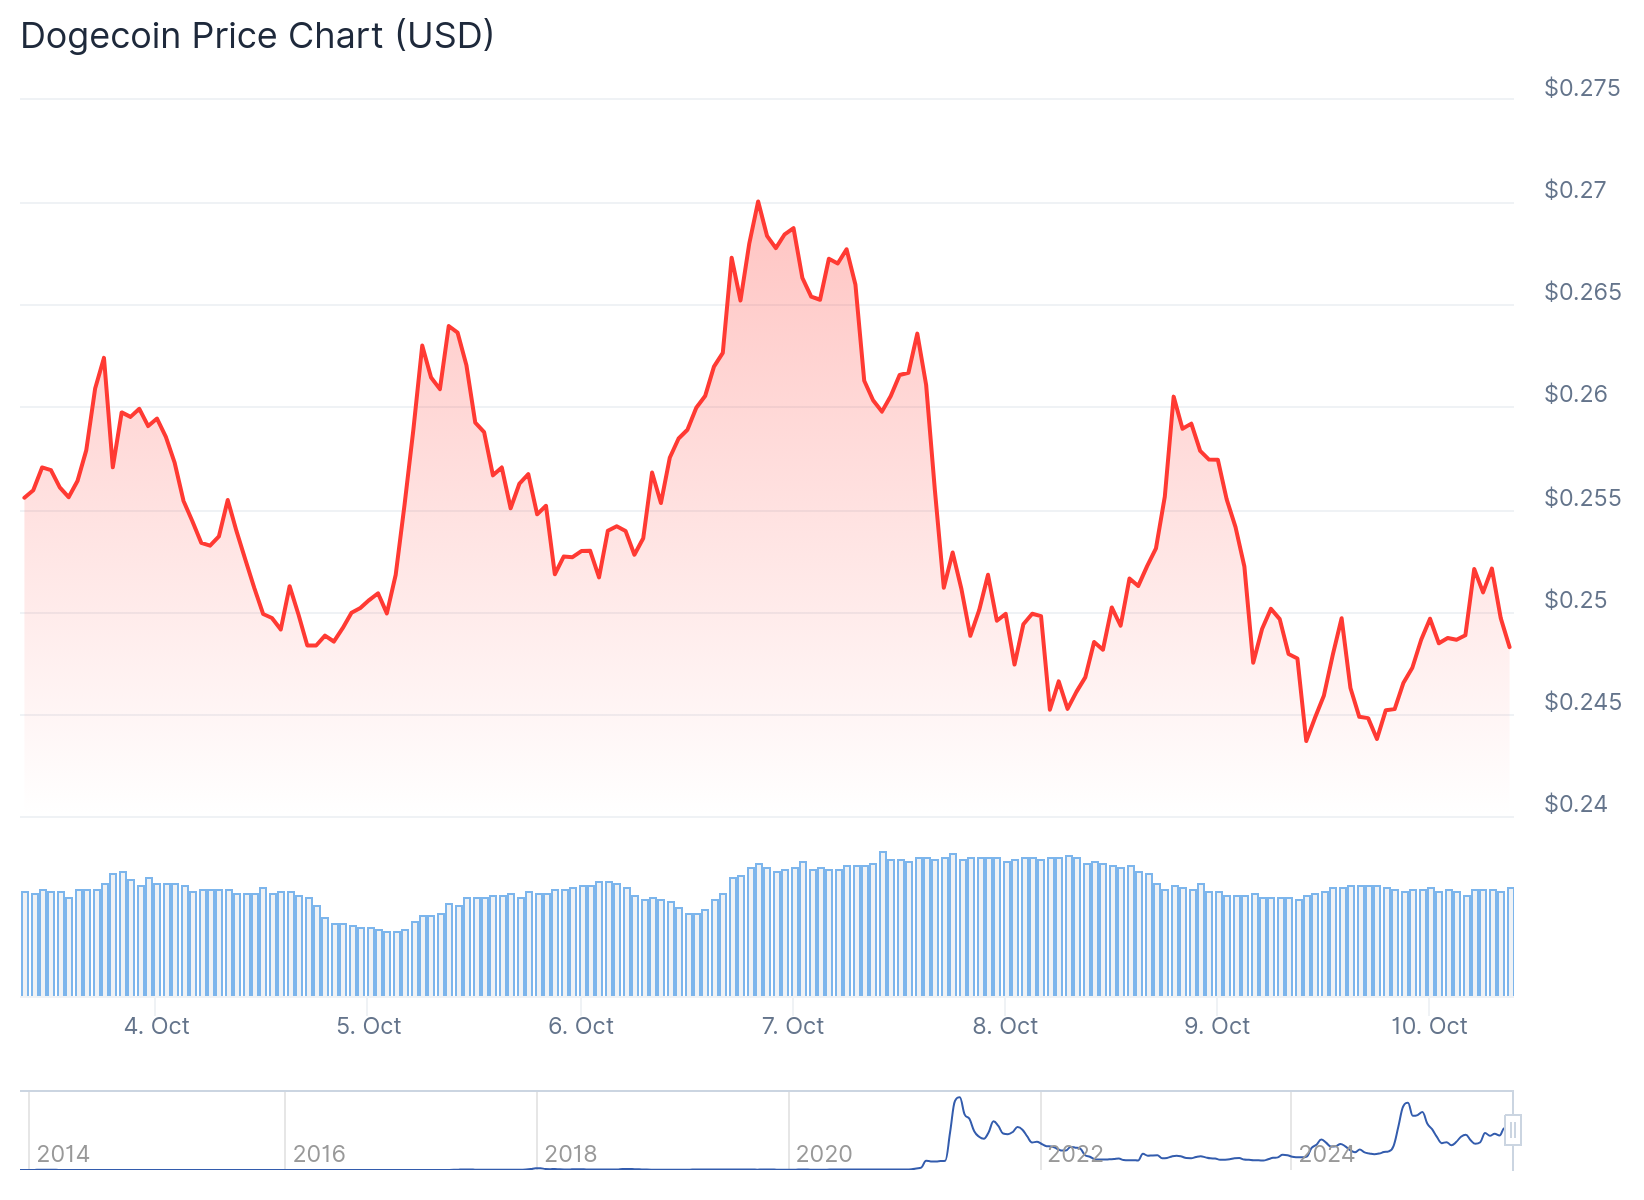
Dogecoin recently declined below the $0.2550 zone. The price fell through $0.2540 support and the 100-hourly simple moving average. The lowest point reached $0.2413 before a recovery attempt began.
The recovery faced resistance near $0.2550. A bearish trend line formed with resistance at $0.2540 on hourly charts. The price currently trades below both the $0.2550 level and the 100-hourly moving average.
Immediate resistance sits at $0.2540 for any upward movement. The first major resistance level stands at $0.2550. Beyond that, the next resistance zone is located at $0.260.
Breaking above $0.260 could open the path toward $0.2780. Additional gains might push the price to $0.2840 or $0.2920 levels.
On the downside, initial support is positioned near $0.2475. The next support level sits at $0.240. The main support zone is located at $0.2320. A break below this point could send the price down to $0.2120 or $0.2050.
Technical indicators show mixed signals. The MACD indicator displays bullish momentum on hourly timeframes. The RSI reading sits above 50, suggesting neutral to slightly positive momentum.
The combination of $23 million in exchange outflows, institutional ETF developments, and long-term technical patterns creates multiple data points for traders to monitor. The price action at current resistance levels will determine whether Dogecoin begins its next rally phase or continues consolidation.
Get 3 Free Stock Ebooks
Discover top-performing stocks in AI, Crypto, and Technology with expert analysis.
- Top 10 AI Stocks - Leading AI companies
- Top 10 Crypto Stocks - Blockchain leaders
- Top 10 Tech Stocks - Tech giants

