
 Price Analysis: Bullish Patterns Hint at Major Breakout Ahead")
TLDR
- DOGE holds $0.21 support after 3% daily decline, testing key technical levels
- Multiple bullish patterns emerge including triangle, cup-and-handle, and rounding bottom formations
- Resistance at $0.29 could unlock rally potential toward $0.80 target by Q4 2025
- Network hash rate increases while RSI shows momentum improvement from oversold levels
- Risk-reward ratio hits 6.5 as technical indicators align for potential breakout
Dogecoin price action centers around the $0.21 support zone as technical analysts identify multiple bullish chart patterns. The meme cryptocurrency has dropped 3% in 24 hours but maintains crucial support levels that could determine its next move.
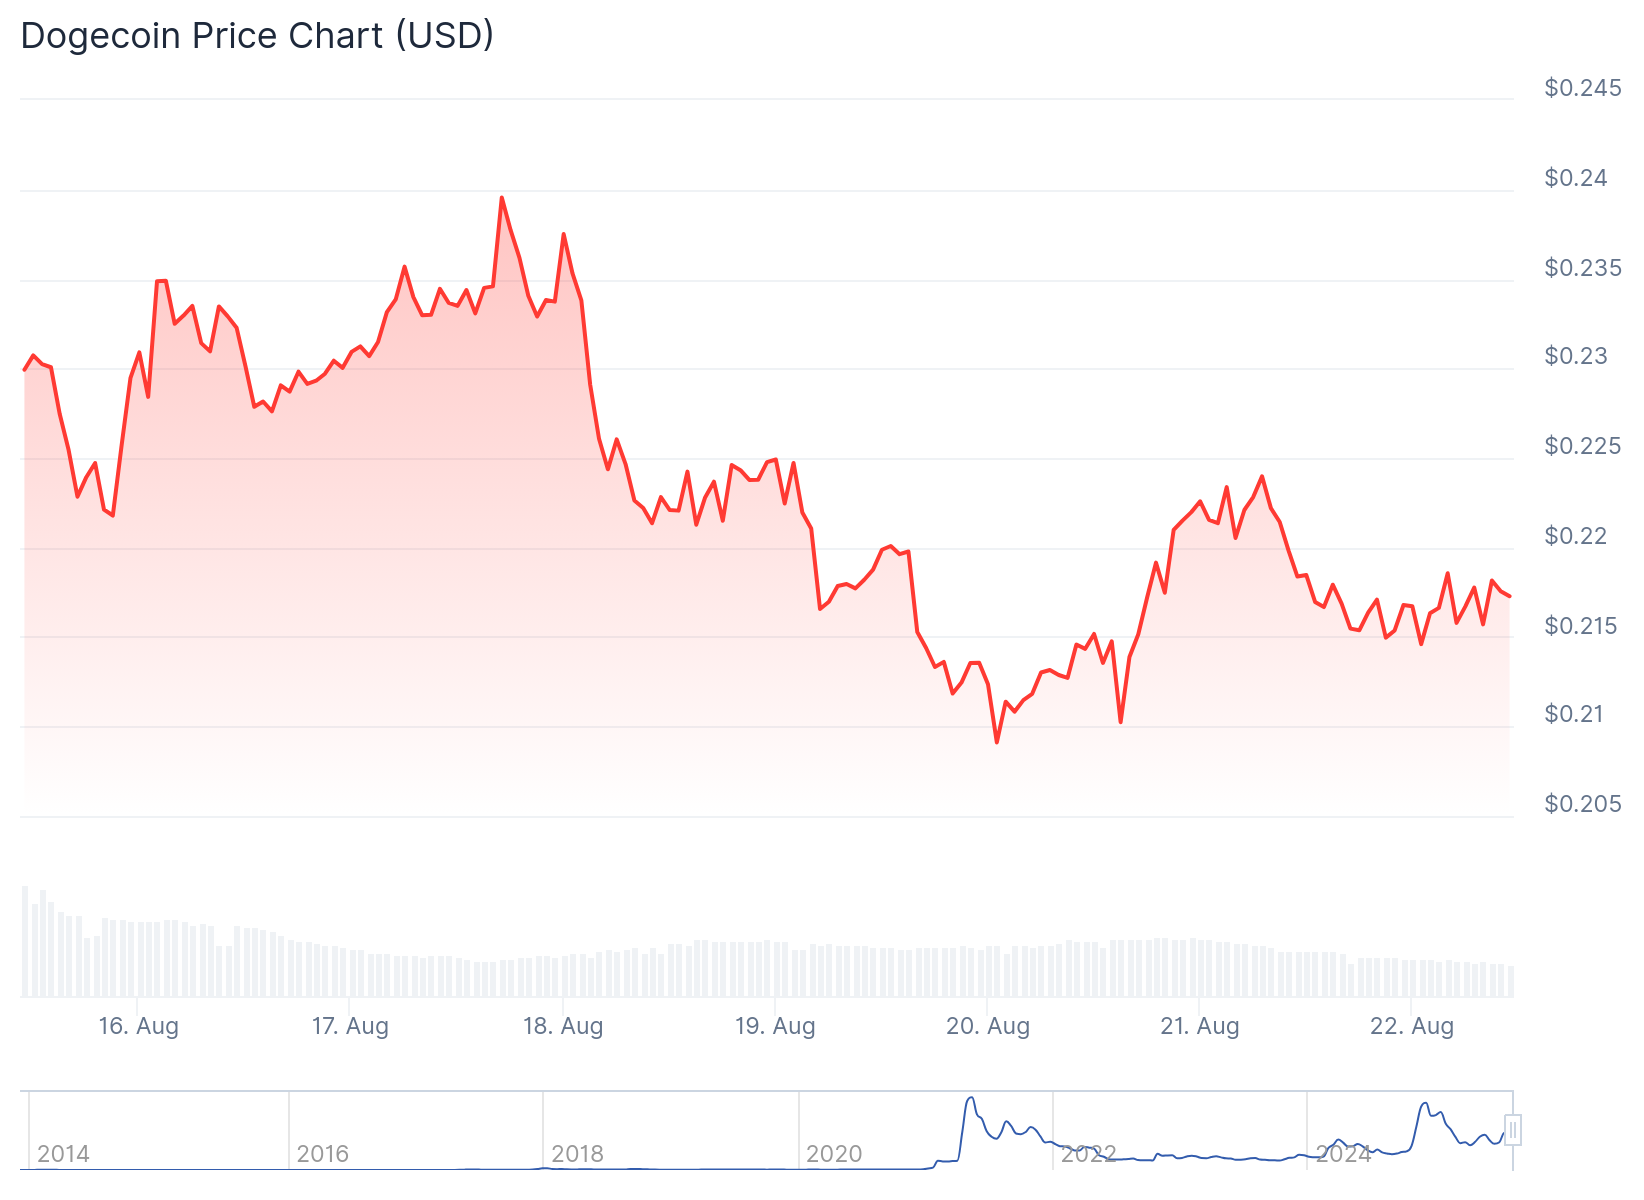
The token currently trades at $0.2152 after failing to sustain momentum above $0.24. DOGE has formed lower highs and lows recently, creating bearish short-term sentiment.
However, analyst Zeinab identified a rounding bottom formation on Dogecoin charts. This pattern typically develops before new uptrend cycles begin.
The token also moves within a converging triangle pattern. These formations signal decreasing volatility before potential breakouts occur.
Cardano Price Prediction
The primary resistance level sits at $0.29 according to technical analysis. A clear break above this zone could mirror previous rallies when DOGE climbed from $0.18 to $0.49.
Extended momentum could push the token toward $0.80 by the final quarter of 2025. This target depends on sustained buying pressure and volume confirmation.

Support ranges between $0.19 and $0.20 form the critical floor. Analyst Andrew Griffiths said holding this area enables potential advances toward $0.38 resistance.
Cryptoinsightuk calculated a 6.5 risk-to-reward ratio for current setups. The analyst noted DOGE swept both recent highs and lows, clearing stop orders on both sides.
Technical Indicators Show Mixed Signals
The Relative Strength Index sits at 47.33, below the neutral 50 level. RSI has turned upward after reaching oversold territory below 30.
This momentum shift aligns with potential price recovery according to short-term analysis. The indicator approaches the midpoint, suggesting improving conditions.
MACD remains bearish with the line at -0.00203 below the signal. Histogram bars turn red, indicating continued pressure against buyers.
Bollinger Bands show expanding volatility around current price levels. The upper band at $0.2499 provides resistance while the lower band at $0.1924 marks downside targets.
Network Fundamentals Stay Strong
Network metrics support long-term bullish cases despite price weakness. The Network Stress Index shows stability in fees, hash rate, and supply dynamics.
Hash rate continues climbing, indicating miner confidence in the blockchain. This metric measures computational power securing the network.
Valuation models like CVDD suggest potential targets near $0.54 based on dormant coin movements. These models have worked for Bitcoin and Litecoin in previous cycles.
Volume trends show steady buying interest over recent weeks. However, liquidity remains below levels recorded during previous major rallies.
Dogecoin market capitalization stands around $33 billion with daily trading volume near $3.4 billion. The all-time high remains at $0.7375 from previous bull market peaks.
The token has declined 4.4% over seven days and 17% over the past month, creating potential entry opportunities for technical traders.
Get 3 Free Stock Ebooks
Discover top-performing stocks in AI, Crypto, and Technology with expert analysis.
- Top 10 AI Stocks - Leading AI companies
- Top 10 Crypto Stocks - Blockchain leaders
- Top 10 Tech Stocks - Tech giants

