
 Price Analysis: Could a 350% Rally Be on the Horizon?")
Key Takeaways
- DOGE price currently hovering around $0.094 within a descending triangle pattern established since 2021 highs
- Critical resistance zone positioned at $0.10; successful breach may unlock price targets between $0.20 and $0.30
- Elliott Wave technical framework indicates DOGE might be finishing its final corrective wave around $0.093–$0.094
- Technical analyst Javon Marks spots hidden bullish divergence pattern with potential upside to $0.44
- Blockchain metrics reveal 60,000–110,000 active daily addresses, indicating consistent network engagement
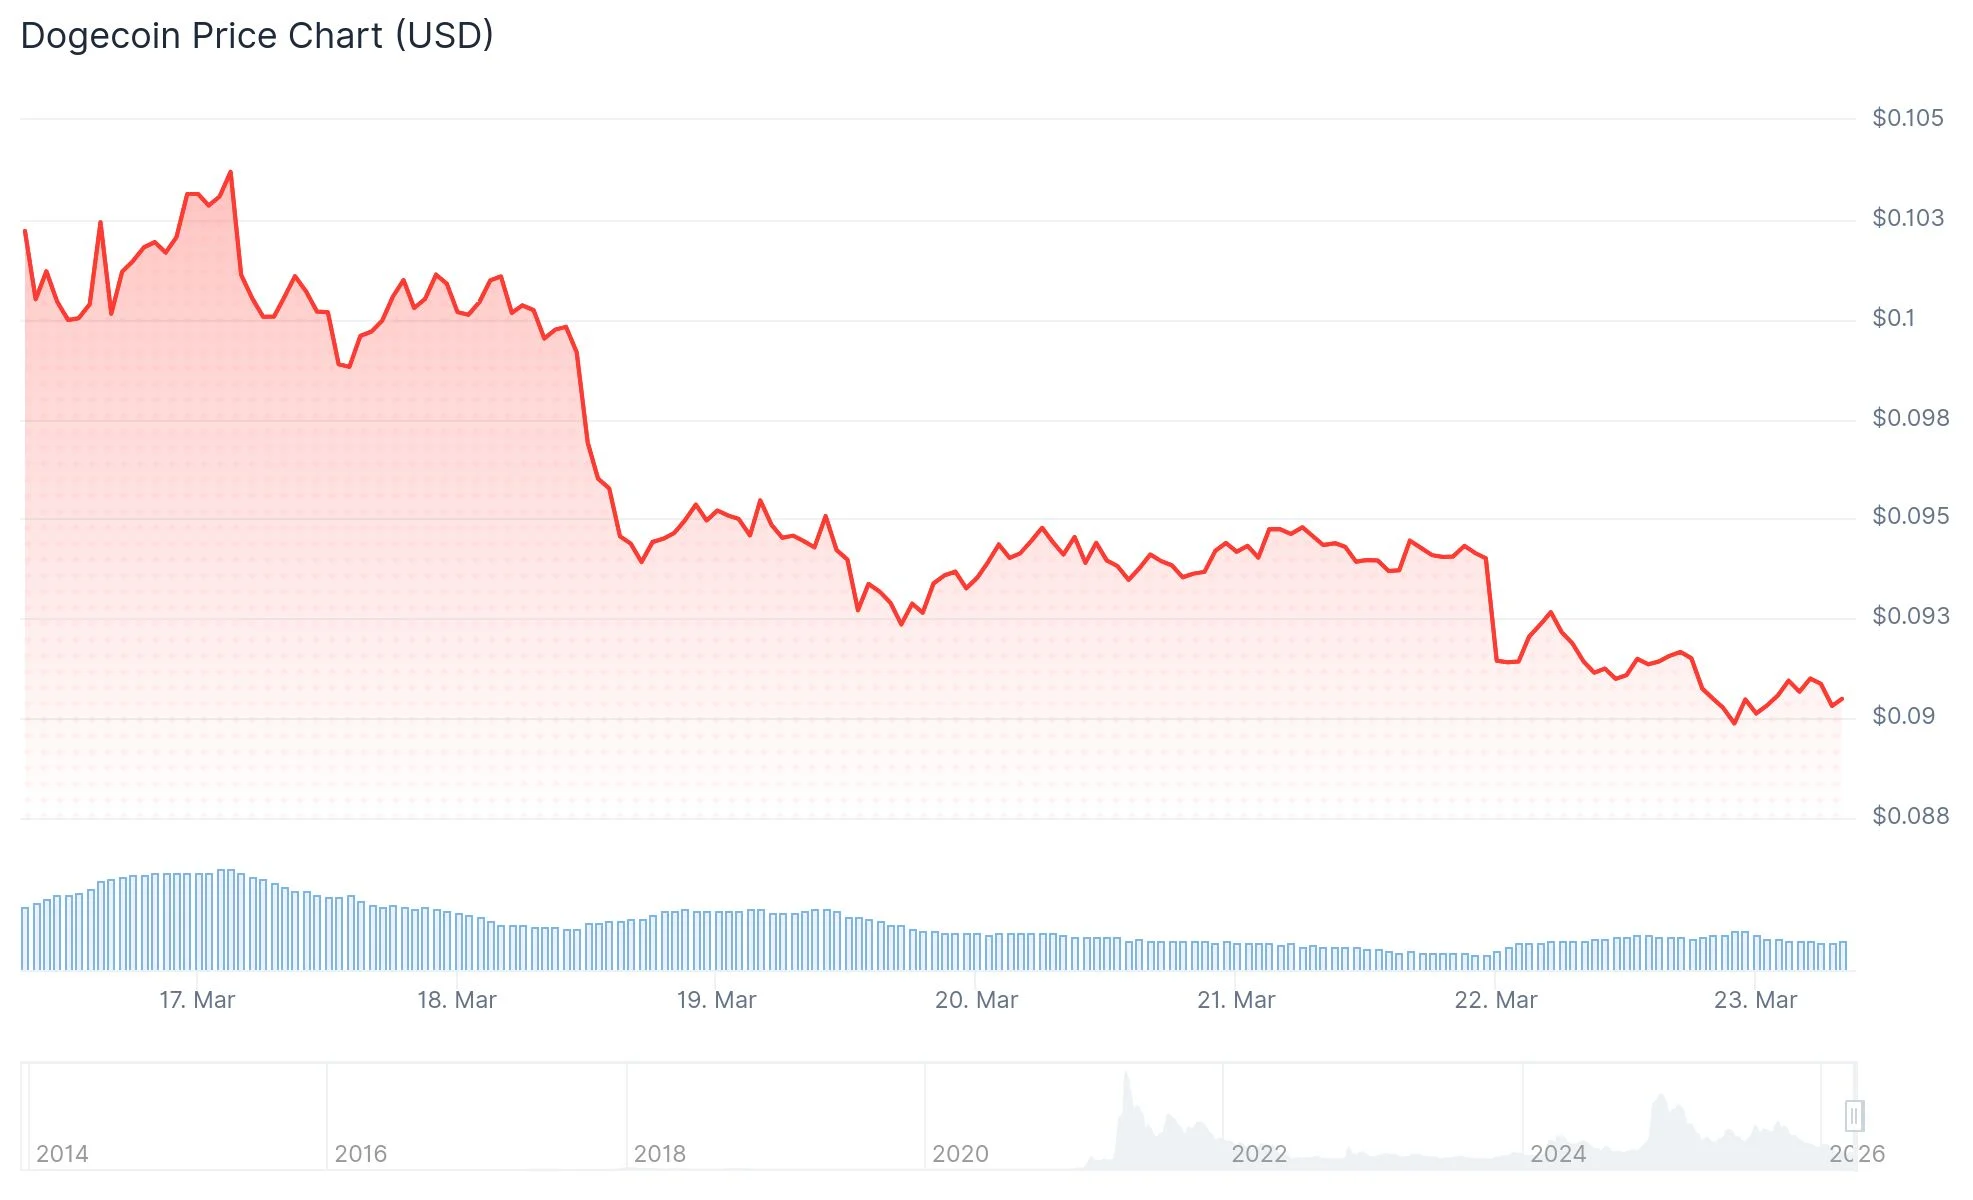
Dogecoin (DOGE) continues to trade in the vicinity of $0.094 as of March 21–22, 2026, remaining confined within a prolonged technical consolidation pattern that market participants are closely monitoring.
Following its May 2021 record high of $0.73, DOGE has experienced approximately 73% depreciation and transitioned into an extended sideways trading phase. Weekly chart analysis reveals a series of descending peaks forming a triangle compression pattern, while support has maintained stability within the $0.055 to $0.08 corridor.
CryptoPatel, a technical market analyst, drew attention to this configuration, observing that DOGE currently resides near the top boundary of this long-duration compression structure. The formation indicates that market volatility has diminished as downward momentum weakens.
Market commentator Crypto Lens references a 5-year demand area positioned around $0.07867. Historical breakouts from comparable chart patterns have generated rallies of +173%, +180%, and +421%, although historical performance doesn’t ensure similar future results.
Elliott Wave Framework and Divergence Signals
Certain technical analysts are interpreting the current structure using Elliott Wave methodology. According to this perspective, DOGE may be nearing completion of the fifth and concluding segment of a corrective downward movement, with Fibonacci-based target zones situated between $0.093 and $0.094.

Should this wave pattern conclude around present price levels, purchasing interest could emerge to challenge resistance barriers at $0.098–$0.10.
Independently, market analyst Javon Marks has detected a hidden bullish divergence pattern developing within the $0.093–$0.095 price range. The price action is establishing higher lows above $0.09, while momentum indicators are registering lower lows — a configuration frequently linked with diminishing downside pressure.
Marks proposes that if this divergence pattern materializes fully, DOGE might experience an upward movement exceeding 350%, potentially reaching price levels above $0.44 from approximately $0.093.
Critical Price Zones Under Observation
TradingView technical indicator aggregates continue displaying a “Sell” reading across moving average systems. Momentum oscillators such as RSI and Stochastic indicators remain predominantly in neutral territory.
Market participants are focusing on these critical levels:
- Resistance zones: $0.095 and $0.098
- Major psychological threshold: $0.10
- Support areas: $0.092 and $0.088–$0.090
A weekly candle closure above the descending trendline boundary, accompanied by expanding trading volume, would constitute the most definitive confirmation indicator. Chart projection techniques suggest that a sustained breakout beyond $0.10 could establish price objectives within the $0.20–$0.30 spectrum.
Blockchain analytics from Glassnode and IntoTheBlock reveal daily active address counts fluctuating between 60,000 and 110,000, with daily transaction volumes spanning from 80,000 to 200,000.
As of March 22, 2026, DOGE was changing hands at $0.09191, reflecting a 2.81% decline across the previous 24-hour period. The $0.09 support threshold remains the critical structural foundation that market participants continue to observe.
Get 3 Free Stock Ebooks
Discover top-performing stocks in AI, Crypto, and Technology with expert analysis.
- Top 10 AI Stocks - Leading AI companies
- Top 10 Crypto Stocks - Blockchain leaders
- Top 10 Tech Stocks - Tech giants

