
 Price: Analyst Predicts 30% Breakout as Triangle Pattern Tightens")
Key Takeaways
- Dogecoin slipped beneath $0.0930, reaching lows around $0.0903
- Current trading activity sits below the 100-hour simple moving average
- Technical charts reveal a descending triangle formation on the 4-hour timeframe
- Crypto analyst Ali Martinez highlights increasing probability of 30% price swing
- Technical indicators show MACD “Buy” signal while RSI and Bull Bear Power stay Neutral
Dogecoin has experienced a retreat following its inability to maintain support above the $0.0930 threshold. The meme coin penetrated several critical support levels, bottoming out at approximately $0.0903 before staging a modest rebound. Currently, DOGE changes hands below the $0.0920 mark and beneath its 100-hour simple moving average.
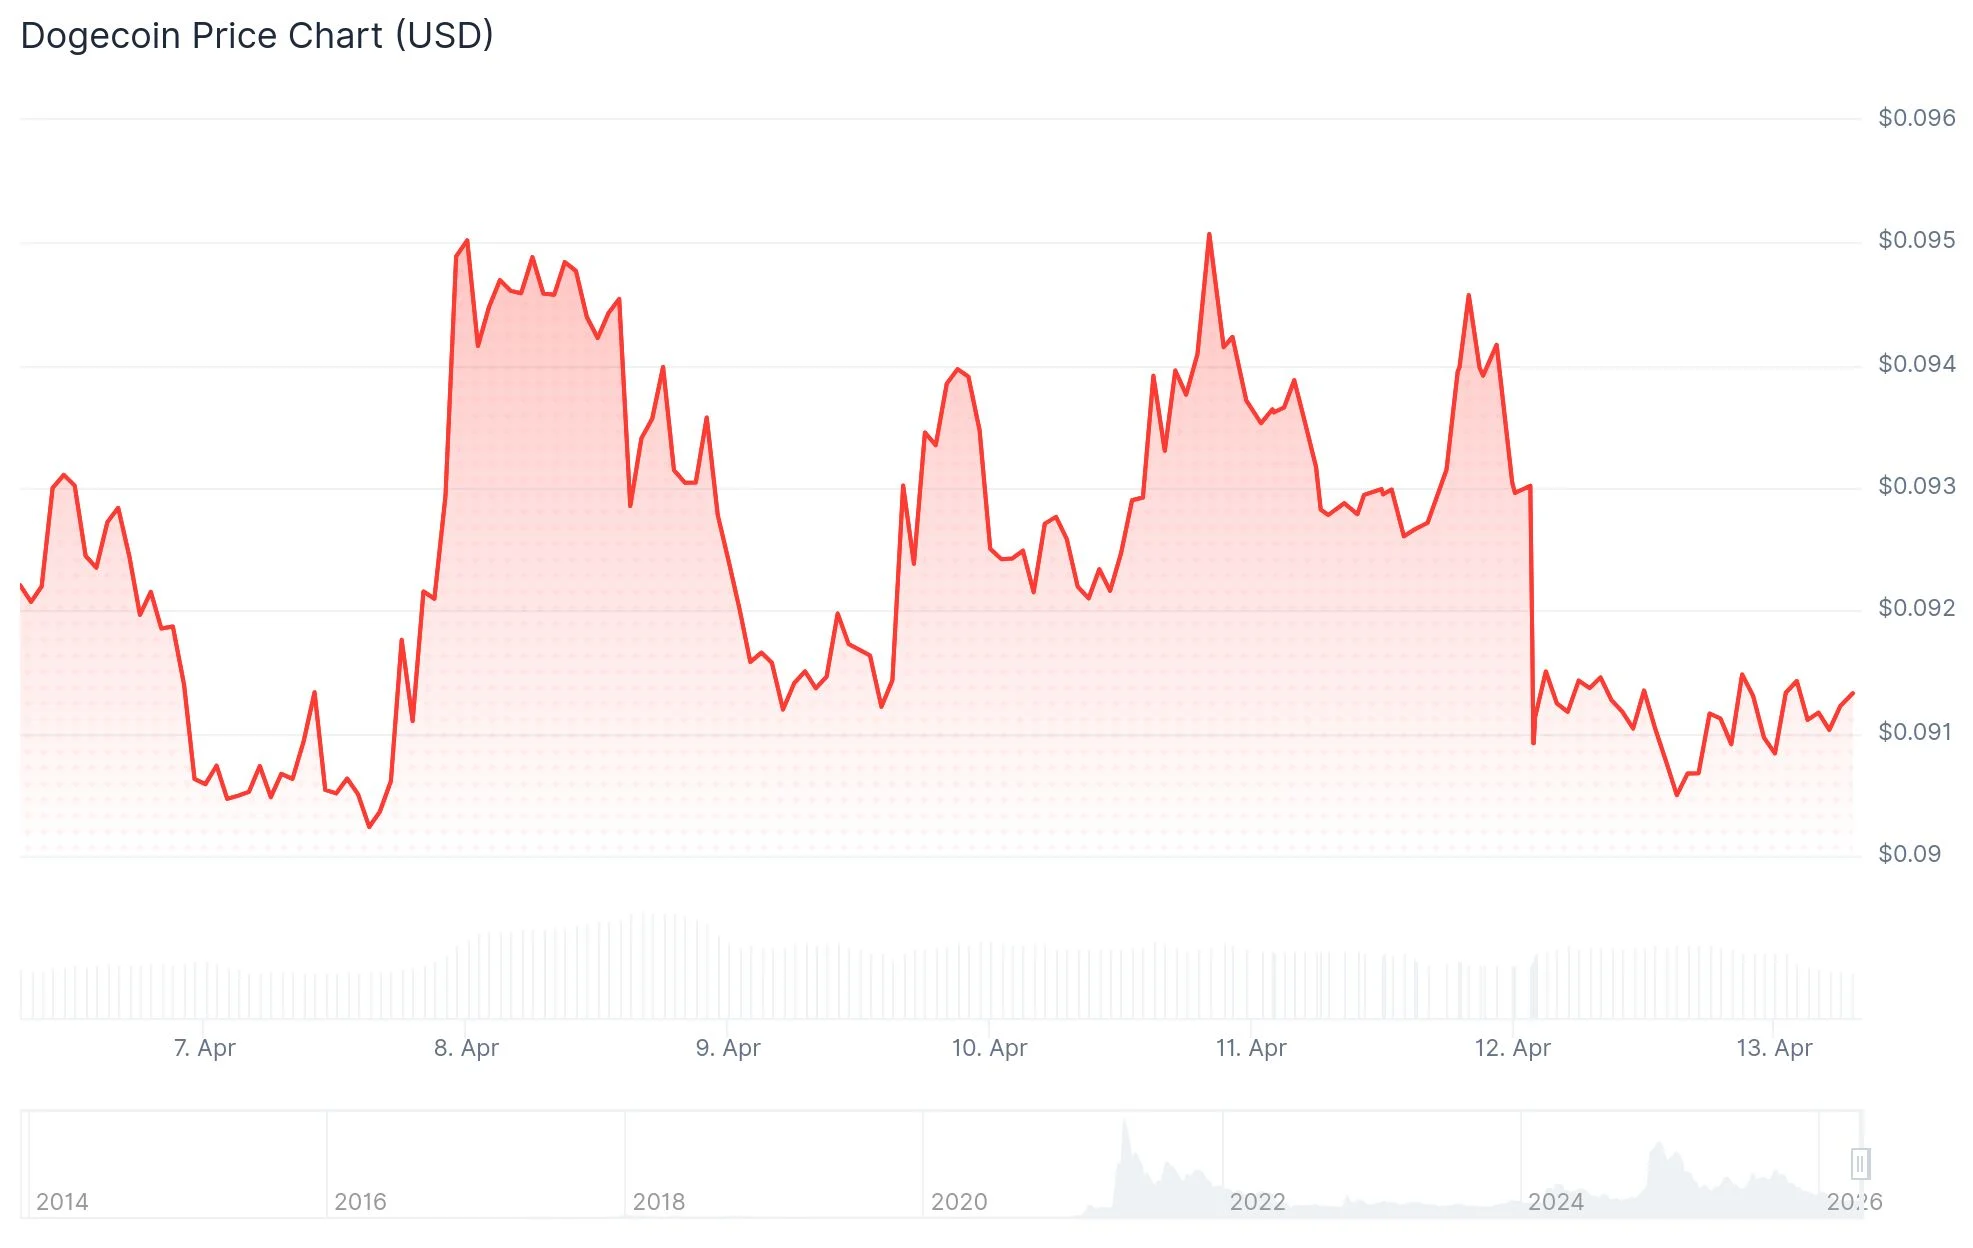
The hourly chart shows a breach of a bullish trend line positioned at $0.0925, introducing additional downward pressure to near-term price action. The subsequent recovery attempt faltered beneath the 23.6% Fibonacci retracement level calculated from the decline between $0.0948 and $0.0903.
Resistance emerges initially at $0.0925, aligning with the 50% Fibonacci retracement of the recent downward move. Additional overhead barriers exist at $0.0930 and $0.0938. Should buyers push through these levels, DOGE could target $0.0950, with extended upside potentially reaching $0.0980.
Regarding downside risks, immediate support materializes at $0.0905. Further below, $0.0900 provides another cushion, while the critical support zone rests at $0.0880. A decisive break beneath $0.0880 would likely accelerate selling pressure toward $0.0820 or potentially $0.0800.
Technical Analyst Identifies Significant Breakout Setup
Renowned crypto analyst Ali Martinez shared an observation via X on April 12, identifying a descending triangle configuration on Dogecoin’s 4-hour chart. Martinez stated: “As Dogecoin $DOGE moves closer to the apex of this triangle, the chances of a 30% move increase substantially.” Notably, Martinez refrained from indicating whether the anticipated move would be bullish or bearish. Should the breakout occur to the upside, a 30% advance would propel DOGE toward $0.11, territory last visited during early February.

Martinez has consistently monitored this technical formation, referencing the triangle pattern across multiple recent assessments.
Futures Market Activity and Technical Signals
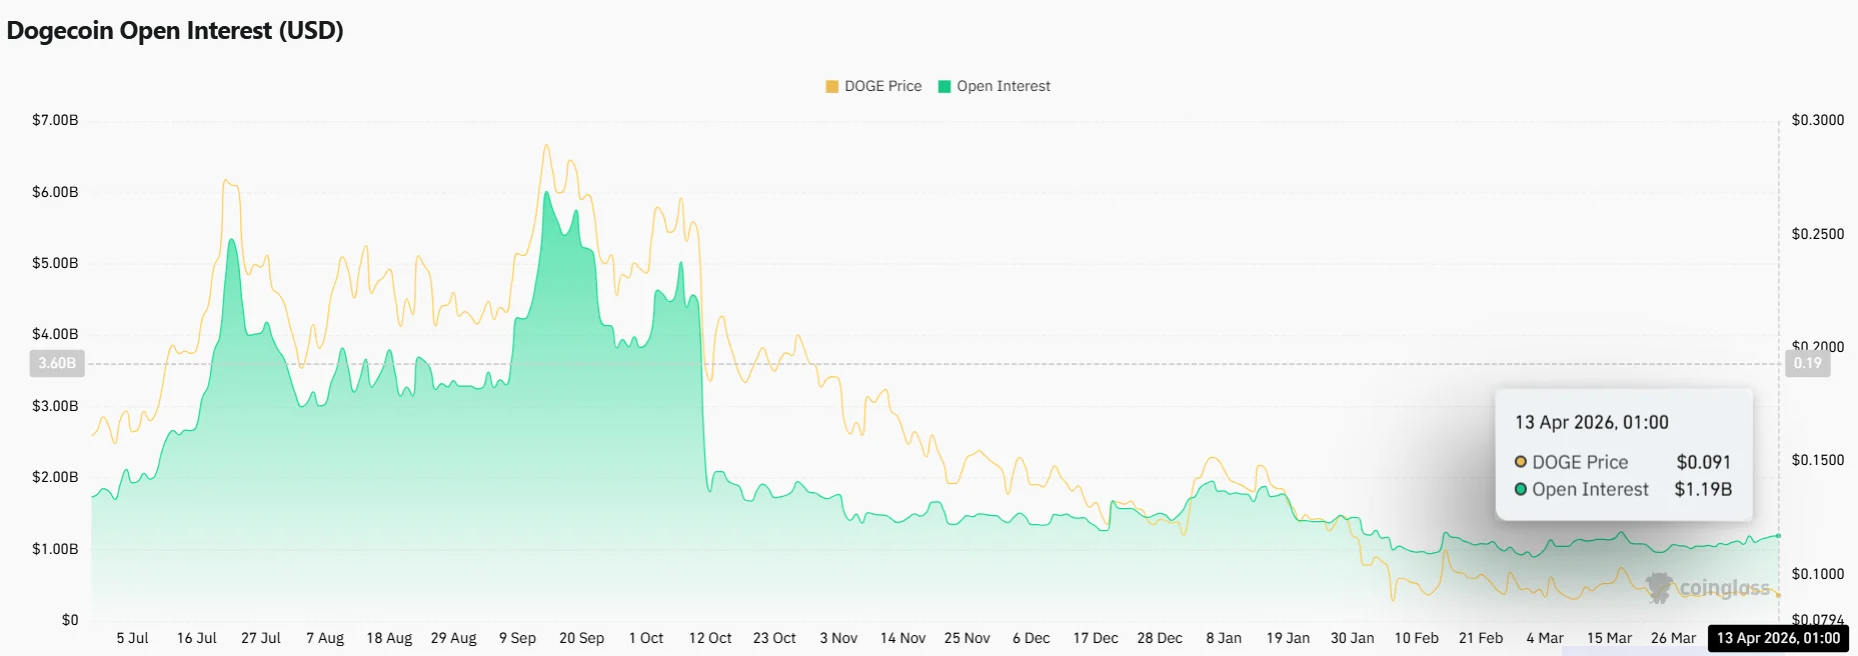
Open interest in DOGE futures climbed 1.61% throughout the past 24 hours, per Coinglass metrics. An increase in open interest during periods of sideways price movement typically indicates accumulation and consolidation ahead of a more significant directional shift.
Large-volume traders operating in the derivatives market maintained a bullish positioning. Meanwhile, retail trader sentiment transitioned to a “Neutral” stance.
TradingView’s MACD indicator generated a “Buy” signal for Dogecoin. Both the Bull Bear Power metric and the Relative Strength Index registered Neutral readings.
Throughout April, Dogecoin has predominantly traded within a defined range, constrained by broader cryptocurrency market headwinds. Coinglass tracking shows open interest in DOGE futures contracts expanded 1.61% over the trailing 24-hour period.
Get 3 Free Stock Ebooks
Discover top-performing stocks in AI, Crypto, and Technology with expert analysis.
- Top 10 AI Stocks - Leading AI companies
- Top 10 Crypto Stocks - Blockchain leaders
- Top 10 Tech Stocks - Tech giants

