
 Price: ETF Filing Triggers Rally as Golden Cross Pattern Emerges")
TLDR
- Dogecoin broke its third descending trendline with previous breaks leading to 230% and 350% rallies
- European asset manager 21Shares filed SEC registration for TDOG ETF, sparking 10% price increase
- Golden cross forming between 100-day and 200-day moving averages on daily chart
- Key resistance at $0.33 identified as potential trigger for broader market movement
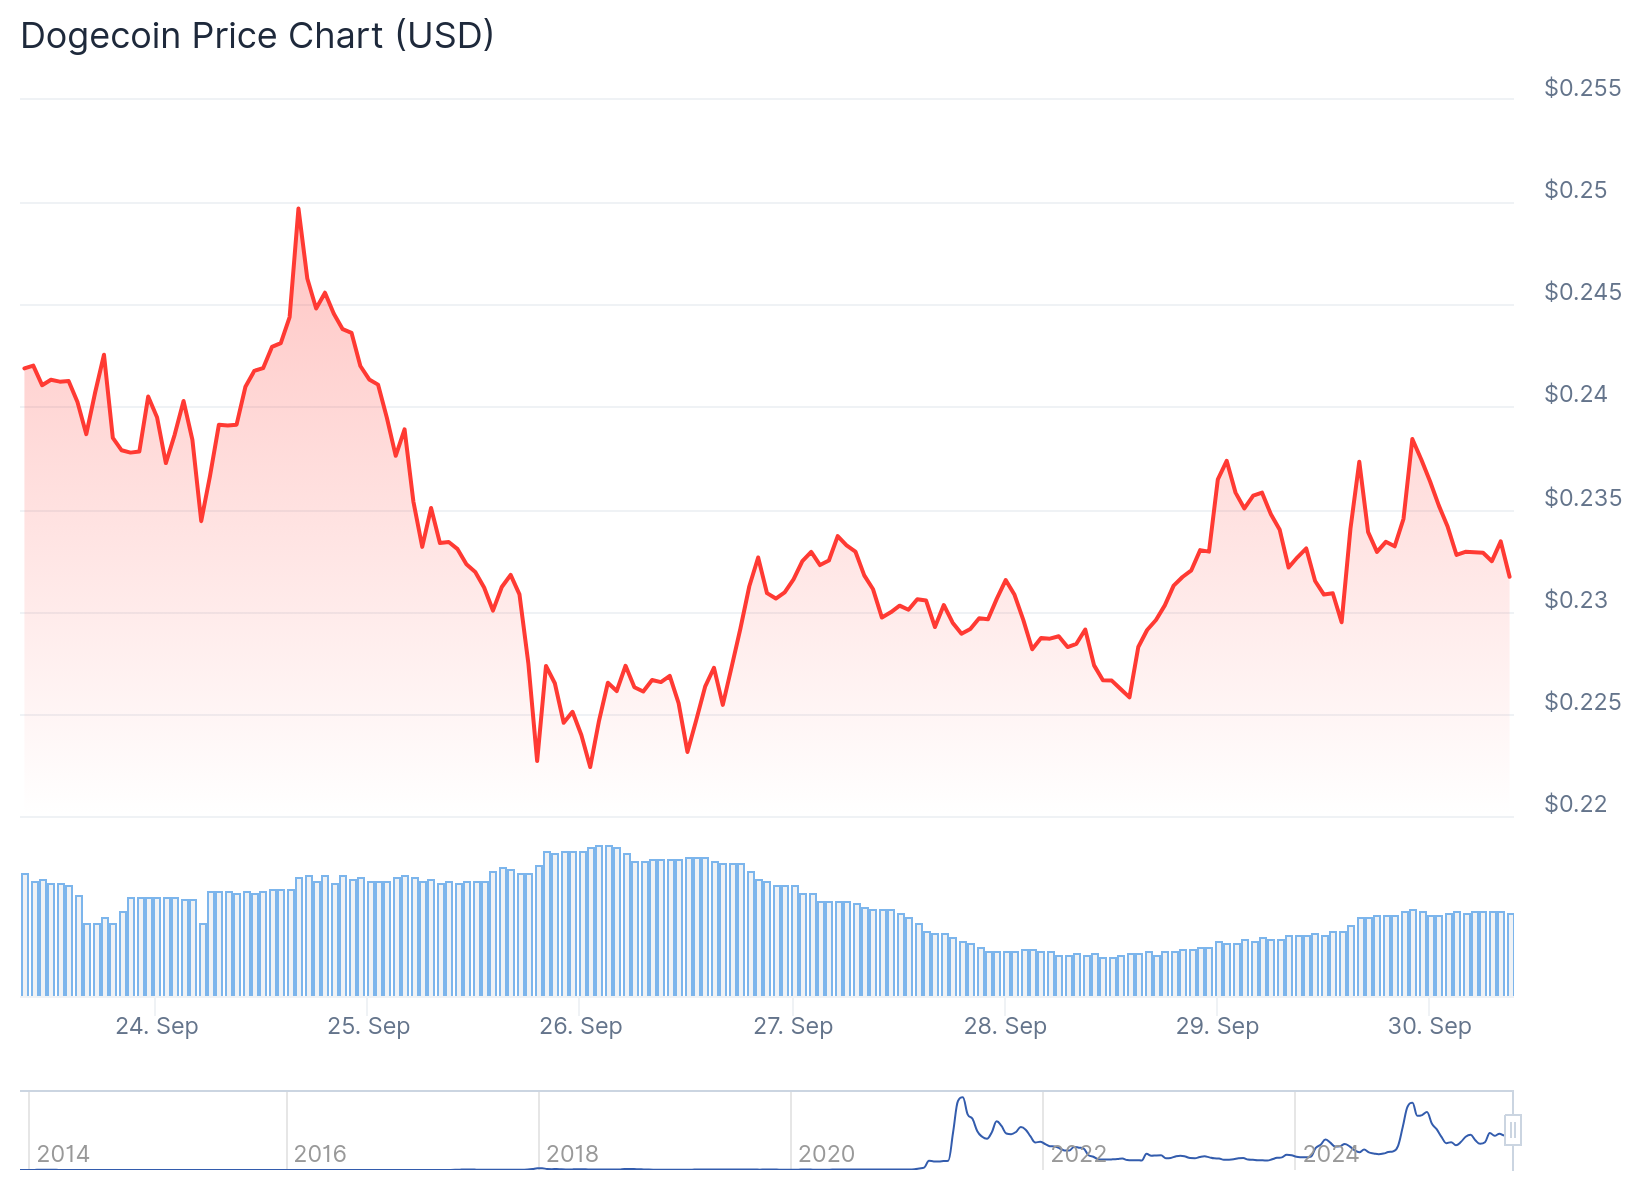
- DOGE currently trades near $0.229 with support at $0.18 and resistance above $0.30
Dogecoin is hovering near $0.229 after completing a breakout from its third multi-month descending trendline. The move coincides with news that 21Shares has filed an amended SEC registration for a Dogecoin exchange-traded fund.
The current technical pattern matches two previous setups that generated substantial returns. A September 2023 trendline break led to a 230% rally. An October 2024 breakout produced a 350% advance.
Crypto analyst Cantonese Cat highlighted these cycles on the weekly chart. Each pattern showed months of downward consolidation followed by a decisive break and expansion phase.
DOGE has pushed through the latest trendline and is now retesting it from above. This retest is occurring on lower momentum compared to prior rallies. The token sits in the middle of what analysts call a return move zone.
Price action since the November-December 2024 peak near $0.48 carved out the third descending line. The recent break and pullback represent a textbook technical sequence.
Moving Average Crossover Approaches
A golden cross is developing on the daily chart as the 100-day simple moving average at $0.2192 approaches the 200-day exponential moving average at $0.2199. This type of crossover has historically preceded extended bullish phases.

Analyst Cas Abbé is tracking this formation with particular interest. He notes that Dogecoin rallies frequently signal the start of broader altcoin market movements.
Abbé identifies $0.33 as the critical level to watch. This resistance point has stopped multiple rally attempts in recent months. A clean break above it could accelerate capital flows into alternative cryptocurrencies across the market.
Liquidity data provides additional context for traders. Heatmaps show concentrated buy orders around $0.18 while supply clusters above $0.30 create resistance.
This structure has led some traders to close long positions and place new bids near the $0.18 support level. The market appears positioned for potential downside tests before any sustained upward move.
21Shares Submits ETF Registration
European asset manager 21Shares filed Amendment No. 1 with the SEC for a Dogecoin trust carrying the ticker TDOG. This marks the firm’s first planned Dogecoin product for U.S. markets.
The SEC filing explicitly labels Dogecoin as a meme coin while clarifying it is not classified as a security. This designation groups DOGE with other tokens receiving similar regulatory treatment.
The filing news generated an immediate 10% intraday price jump. This represents the first measurable market response to institutional ETF interest in Dogecoin.
21Shares operates multiple crypto exchange-traded products in Europe. The TDOG fund would add Dogecoin to its U.S. product lineup if approved.
The prospectus acknowledges Dogecoin’s unlimited supply model. This differs from Bitcoin’s capped supply and represents a fundamental characteristic highlighted in the documentation.
The ETF application remains under review with no approval granted. Previous crypto ETF approvals for Bitcoin and Ethereum in 2024 resulted in rapid institutional inflows and corresponding price appreciation.
Chart Pattern Points to Resistance Test
Technical analyst CobraVanguard identified a cup and handle formation on the weekly timeframe. The cup developed from May 2021 through December 2024 with a high at $0.760.
The handle formed as DOGE dropped to $0.13 in April 2025 before rebounding. Pattern validation would require a break above $0.4846 resistance, representing a 102% gain from current levels.
DOGE now trades at the intersection of multiple technical factors. The historical trendline break pattern, forming golden cross, and institutional ETF filing all converge near current price levels.
Get 3 Free Stock Ebooks
Discover top-performing stocks in AI, Crypto, and Technology with expert analysis.
- Top 10 AI Stocks - Leading AI companies
- Top 10 Crypto Stocks - Blockchain leaders
- Top 10 Tech Stocks - Tech giants

