
 Price: On Chain Data Shows Undervalued Conditions – Time to Buy?")
TLDR
- Dogecoin dropped more than 20% last week alongside other major memecoins, but short-term holders used the dip as a buying opportunity instead of panic selling.
- Multiple on-chain indicators including MVRV Z-Score, Reserve Risk, and Cumulative Value Days Destroyed suggest DOGE is currently undervalued and in an accumulation phase.
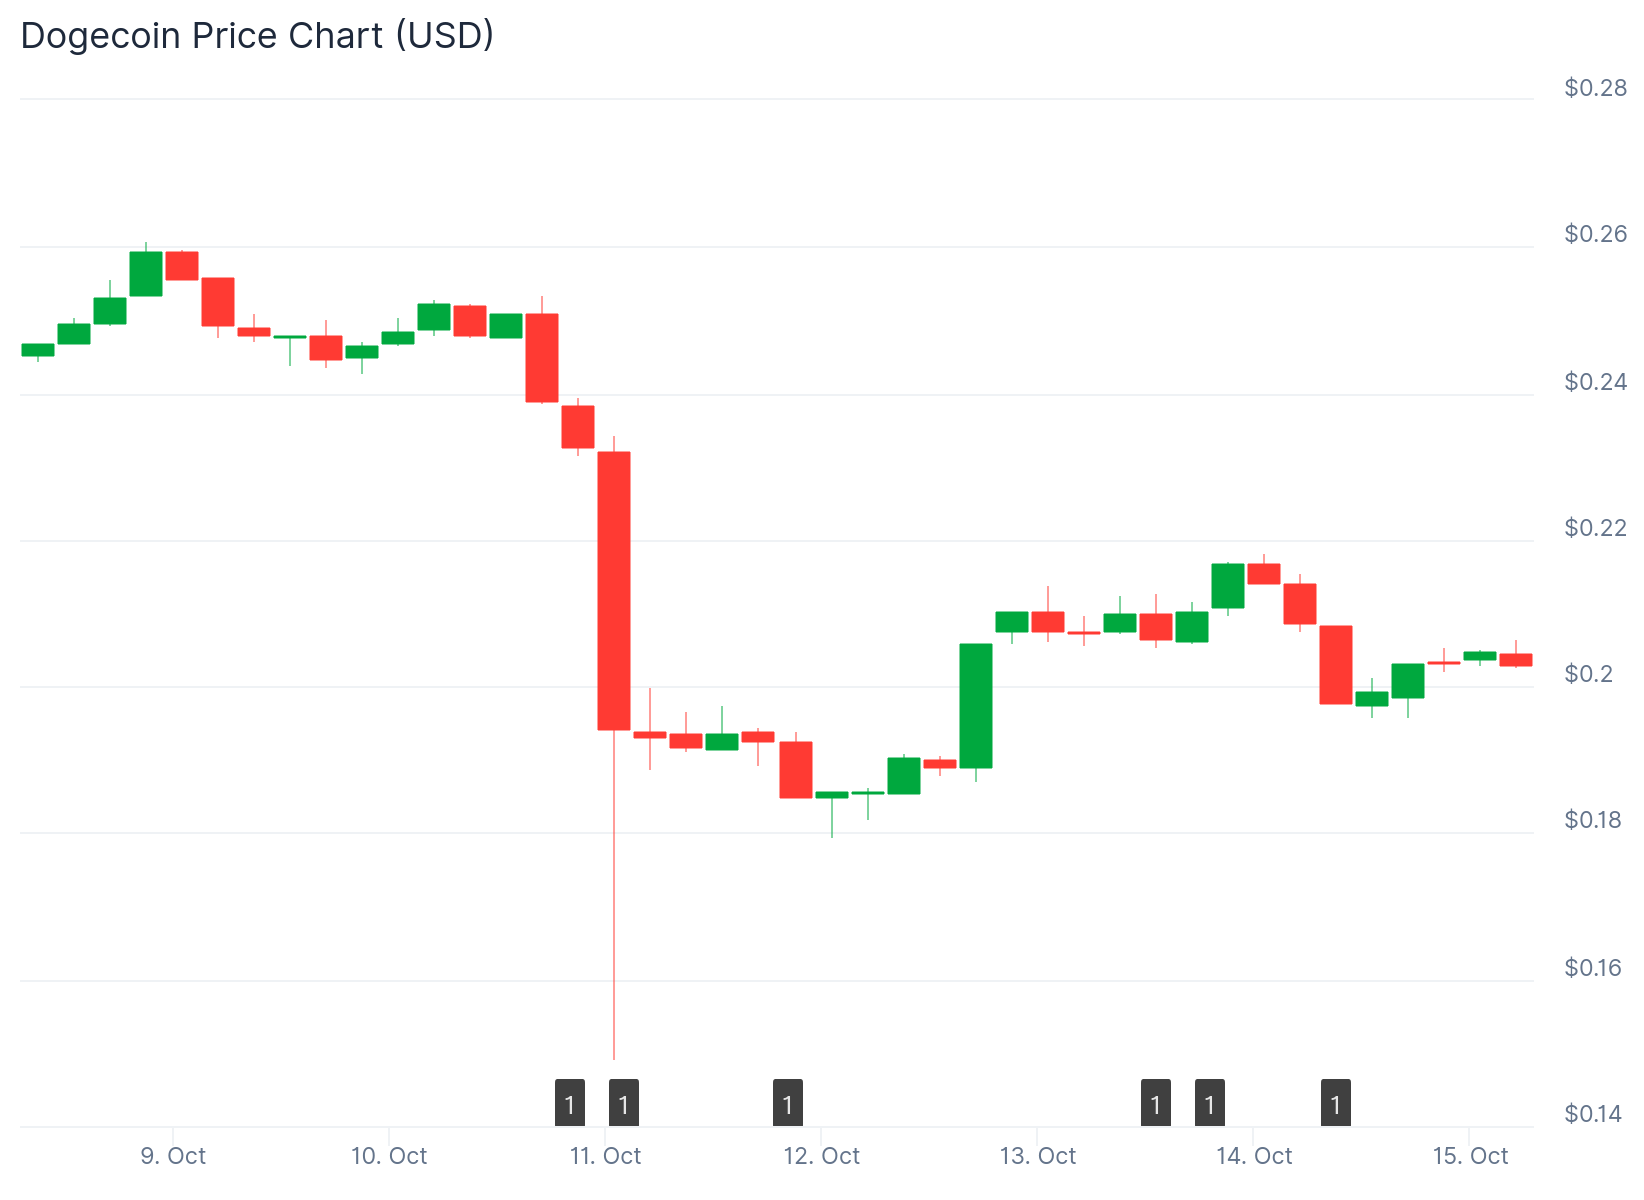
- Technical analysis shows Dogecoin broke above a multi-year resistance line and successfully retested $0.15-$0.16 support, now trading around $0.20-$0.21.
- Key resistance sits at $0.28-$0.30 while the $0.15-$0.16 zone remains critical support that needs to hold for the bullish setup to remain valid.
- The monthly chart pattern combined with on-chain data creates conditions similar to periods before previous bull runs in 2017 and 2021.
Dogecoin experienced a sharp decline last week, dropping over 20% during a broader memecoin market selloff. Other popular tokens like Shiba Inu and Pepe faced similar losses.
The decline erased billions from the combined market value of these digital assets. Newer tokens including Bonk and Floki also couldn’t escape the selling pressure.
Despite the price drop, short-term holders have been accumulating. This buying activity at lower levels suggests some investors view the current prices as attractive entry points.
At press time, Dogecoin was stabilizing above important long-term support zones. The token is hovering near local lows but appears to be finding a floor.
Multiple Metrics Signal Accumulation Phase
The MVRV Z-Score, which tracks when price deviates from fair value, is currently near historic lows. These levels match readings observed before major bull runs in 2017 and 2021.
Past sharp spikes in the MVRV marked market tops. Deep drops below zero frequently preceded strong rebounds.

The Reserve Risk Indicator remains in the green accumulation zone. This shows holder conviction is strong while market confidence hasn’t reached excessive levels.
The Cumulative Value Days Destroyed chart indicates DOGE is holding above its long-term value floor. This pattern resembles periods that came before past rallies.

Current data suggests the market has entered a calmer accumulation phase rather than a speculative peak. While price action stays relatively quiet, on-chain metrics support a potential recovery setup.
Technical Structure Shows Bullish Formation
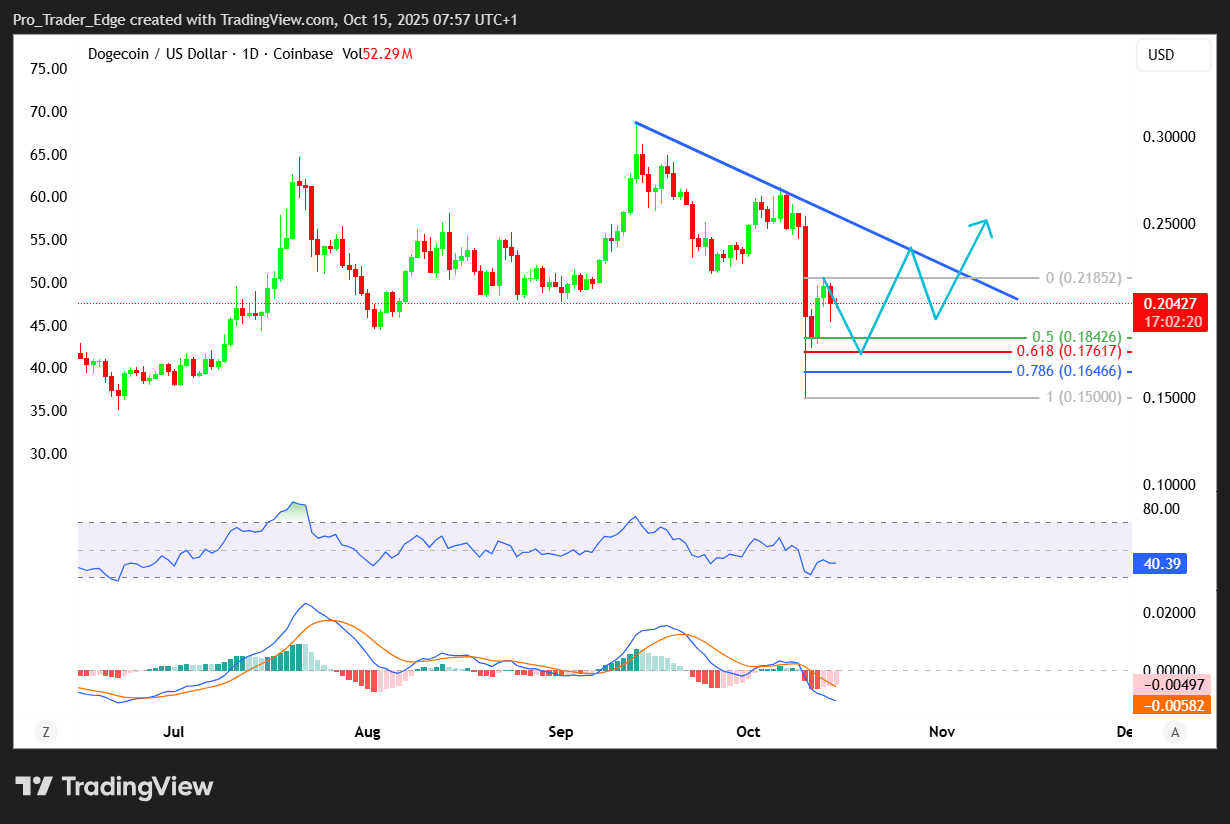
Analyst EtherNasyonaL recently highlighted a key structural retest on Dogecoin’s monthly chart. After spending years below a descending resistance line from the 2021 peak, DOGE finally broke through.
The price formed a broad rounding bottom, which is a classic accumulation pattern. Following the breakout, DOGE pulled back to test the $0.15-$0.16 area as support.
Buyers defended this level aggressively, confirming it as a new floor. Dogecoin now trades around $0.20-$0.21, consolidating above this support zone.
The successful retest strengthens the case for further upside. If these levels hold, another move higher could develop.
Price Levels And Market Context
The $0.15-$0.16 zone serves as critical support. Next major resistance appears at $0.28-$0.30, where previous rallies encountered selling pressure.
Several factors support the current setup. The broader cryptocurrency market has stabilized recently, with Bitcoin’s strength typically providing lift to major altcoins.
On-chain activity has increased. Developers continue exploring new features including tokenization and NFTs on the Dogecoin network.
Retail interest in Dogecoin remains active. The token continues to move based on sentiment and social media engagement.
The monthly chart shows Dogecoin has transitioned from a prolonged downtrend into a more constructive pattern. The breakout combined with the successful support retest creates conditions that could support higher prices.
The combination of undervalued on-chain metrics and improving technical structure suggests Dogecoin may be positioned for upside movement if current support levels hold and broader market conditions remain stable.
Get 3 Free Stock Ebooks
Discover top-performing stocks in AI, Crypto, and Technology with expert analysis.
- Top 10 AI Stocks - Leading AI companies
- Top 10 Crypto Stocks - Blockchain leaders
- Top 10 Tech Stocks - Tech giants

