
 Price Prediction: Will Triangle Pattern Spark Another Massive Rally?")
TLDR
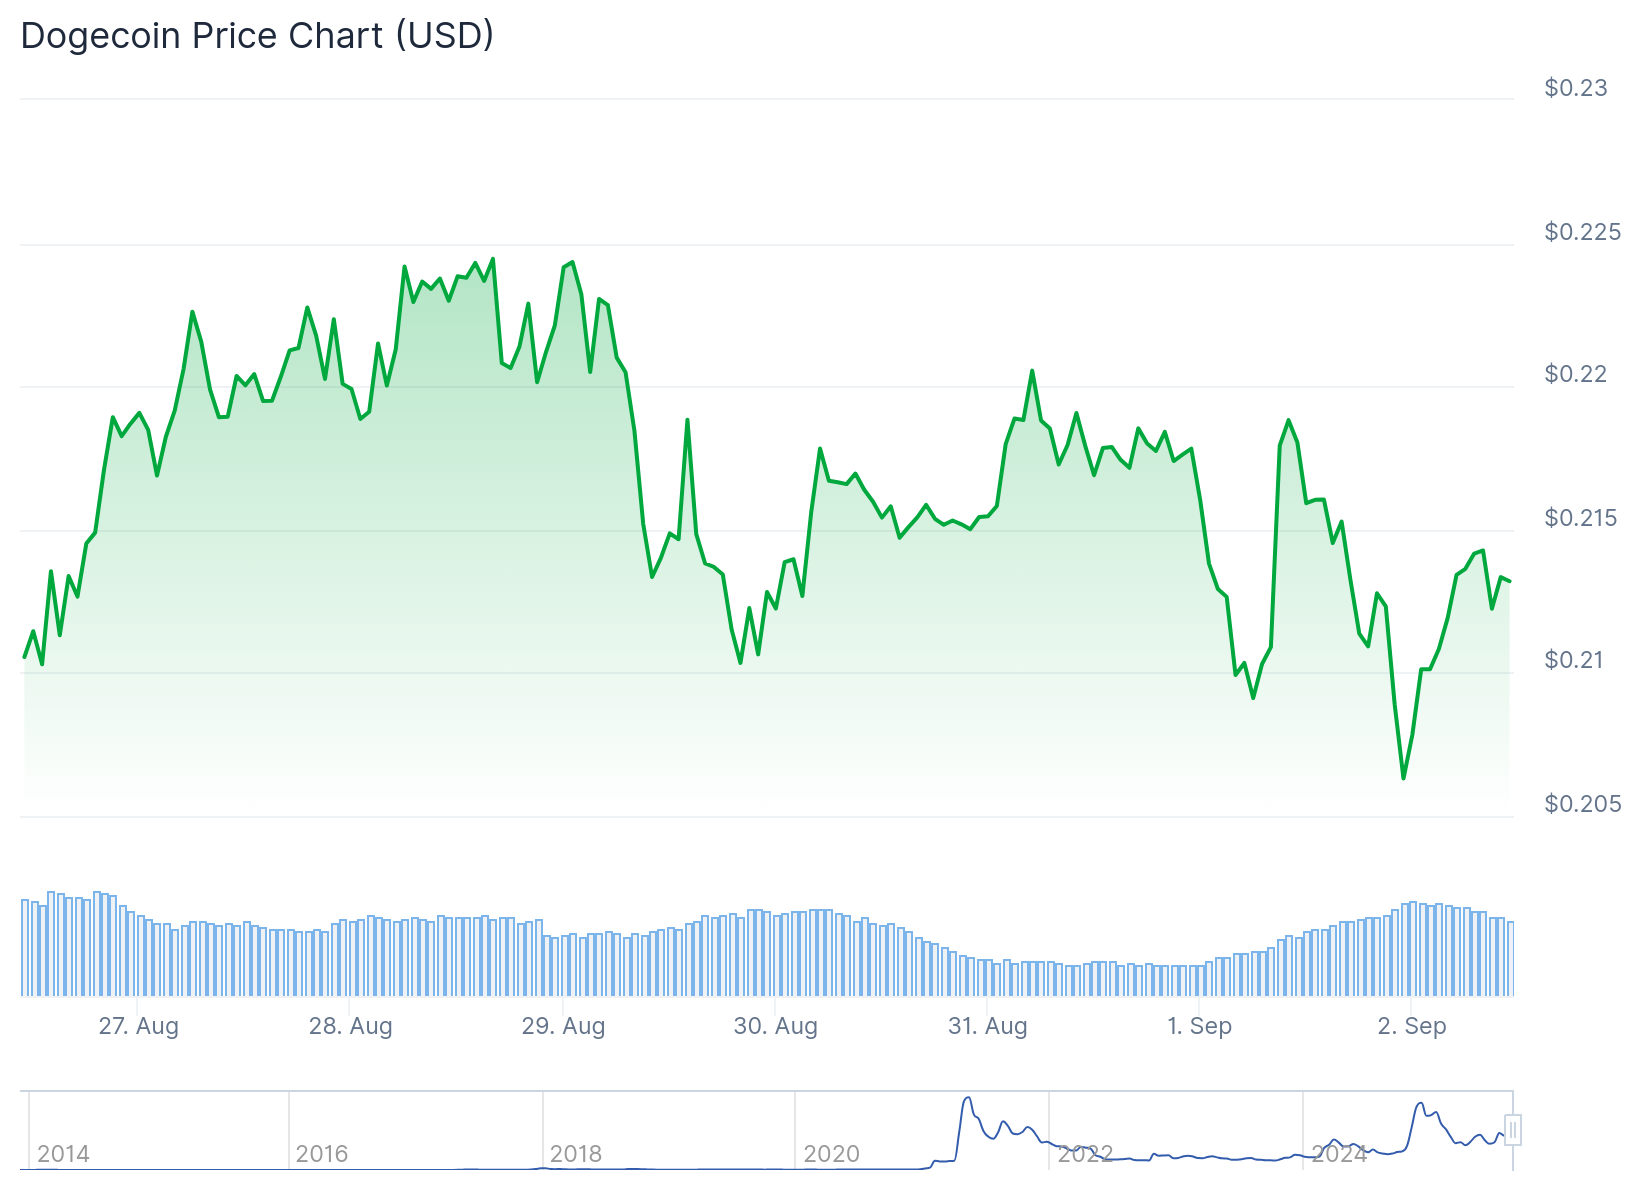
- DOGE trades at $0.214, testing crucial 200-day moving average support at $0.211
- Whales sold 250 million tokens since August 25, creating selling pressure
- Negative funding rates show bearish trader sentiment in derivatives markets
- Triangle pattern mirrors 2016 and 2020 formations that preceded major rallies
- Key targets include $0.253 resistance and potential move toward $0.723
Dogecoin price prediction remains uncertain as the meme coin tests a critical technical level. Trading around $0.214, DOGE faces a make-or-break moment at its 200-day moving average of $0.211.
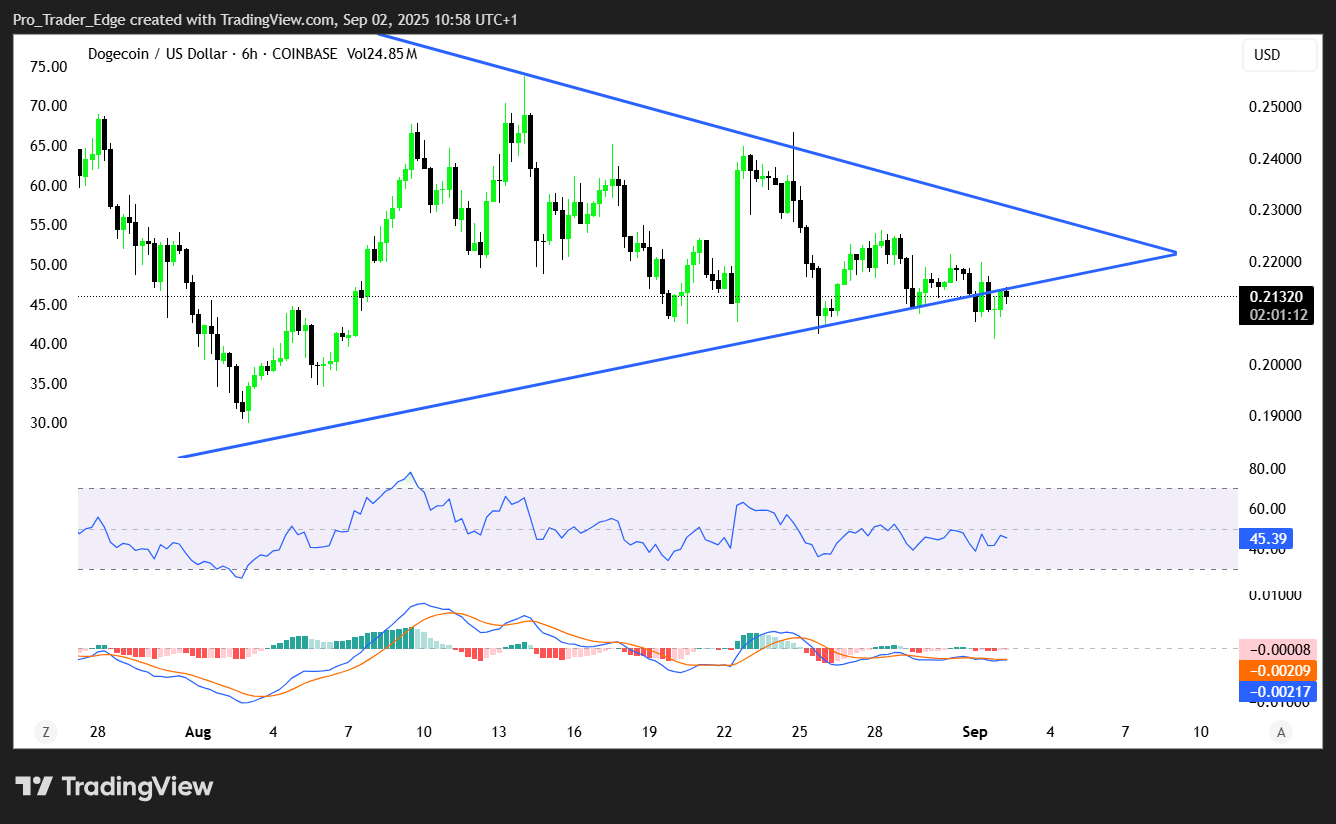
The cryptocurrency has formed a triangle pattern that analysts compare to similar setups from 2016 and 2020. These historical formations preceded explosive price rallies that delivered massive returns to early investors.
Current Market Sentiment Turns Bearish
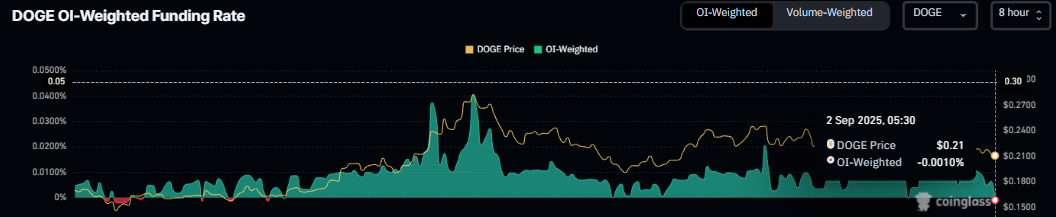
Derivatives data reveals growing pessimism among traders. Funding rates have turned negative to -0.0010%, indicating short sellers now outnumber long positions. This shift typically precedes price declines based on historical patterns.
The long-to-short ratio confirms this bearish sentiment. More traders are betting on DOGE falling rather than rising, creating additional downward pressure on the token.
On-chain metrics support the negative outlook. Santiment data shows whale holders have been reducing their positions across multiple size categories. Large holders containing 100,000 to 1 million DOGE, 1-10 million DOGE, and 10-100 million DOGE have collectively sold 250 million tokens since late August.
Technical Analysis Shows Mixed Signals
The Relative Strength Index sits at 46, below the neutral 50 level. This reading suggests continued bearish momentum in the near term. The MACD indicator displays a bearish crossover, reinforcing the negative technical outlook.

DOGE recently found rejection at a broken ascending trendline, declining 3% afterward. This rejection brought the price down to current levels around the 200-day moving average support.
If DOGE closes below $0.211 on a daily timeframe, the next support target sits at $0.181. This weekly support level could become the destination if selling pressure intensifies.
However, the triangle formation presents bullish potential. The pattern shows DOGE pushing against descending resistance while maintaining ascending support. Similar setups in previous market cycles led to breakouts that reached new price highs.
Dogecoin Price Prediction
Resistance levels await at $0.253 and $0.370 for any potential upward movement. Breaking these zones could open the path toward $0.723, representing DOGE’s all-time high from 2021.
The $0.211 level serves as the critical decision point. A hold above this support could trigger recovery toward $0.247 daily resistance, keeping the triangle pattern intact.
Traders should monitor the 200-day moving average closely. A decisive break below could extend the correction to $0.181, while holding support may set up another attempt at the triangle breakout that mirrors historical patterns.
The conflicting signals between bearish short-term metrics and bullish long-term patterns make this a pivotal moment for Dogecoin price prediction.
Get 3 Free Stock Ebooks
Discover top-performing stocks in AI, Crypto, and Technology with expert analysis.
- Top 10 AI Stocks - Leading AI companies
- Top 10 Crypto Stocks - Blockchain leaders
- Top 10 Tech Stocks - Tech giants

