
 Price: Triangle Pattern Compression Sets Stage for Major Move")
TLDR
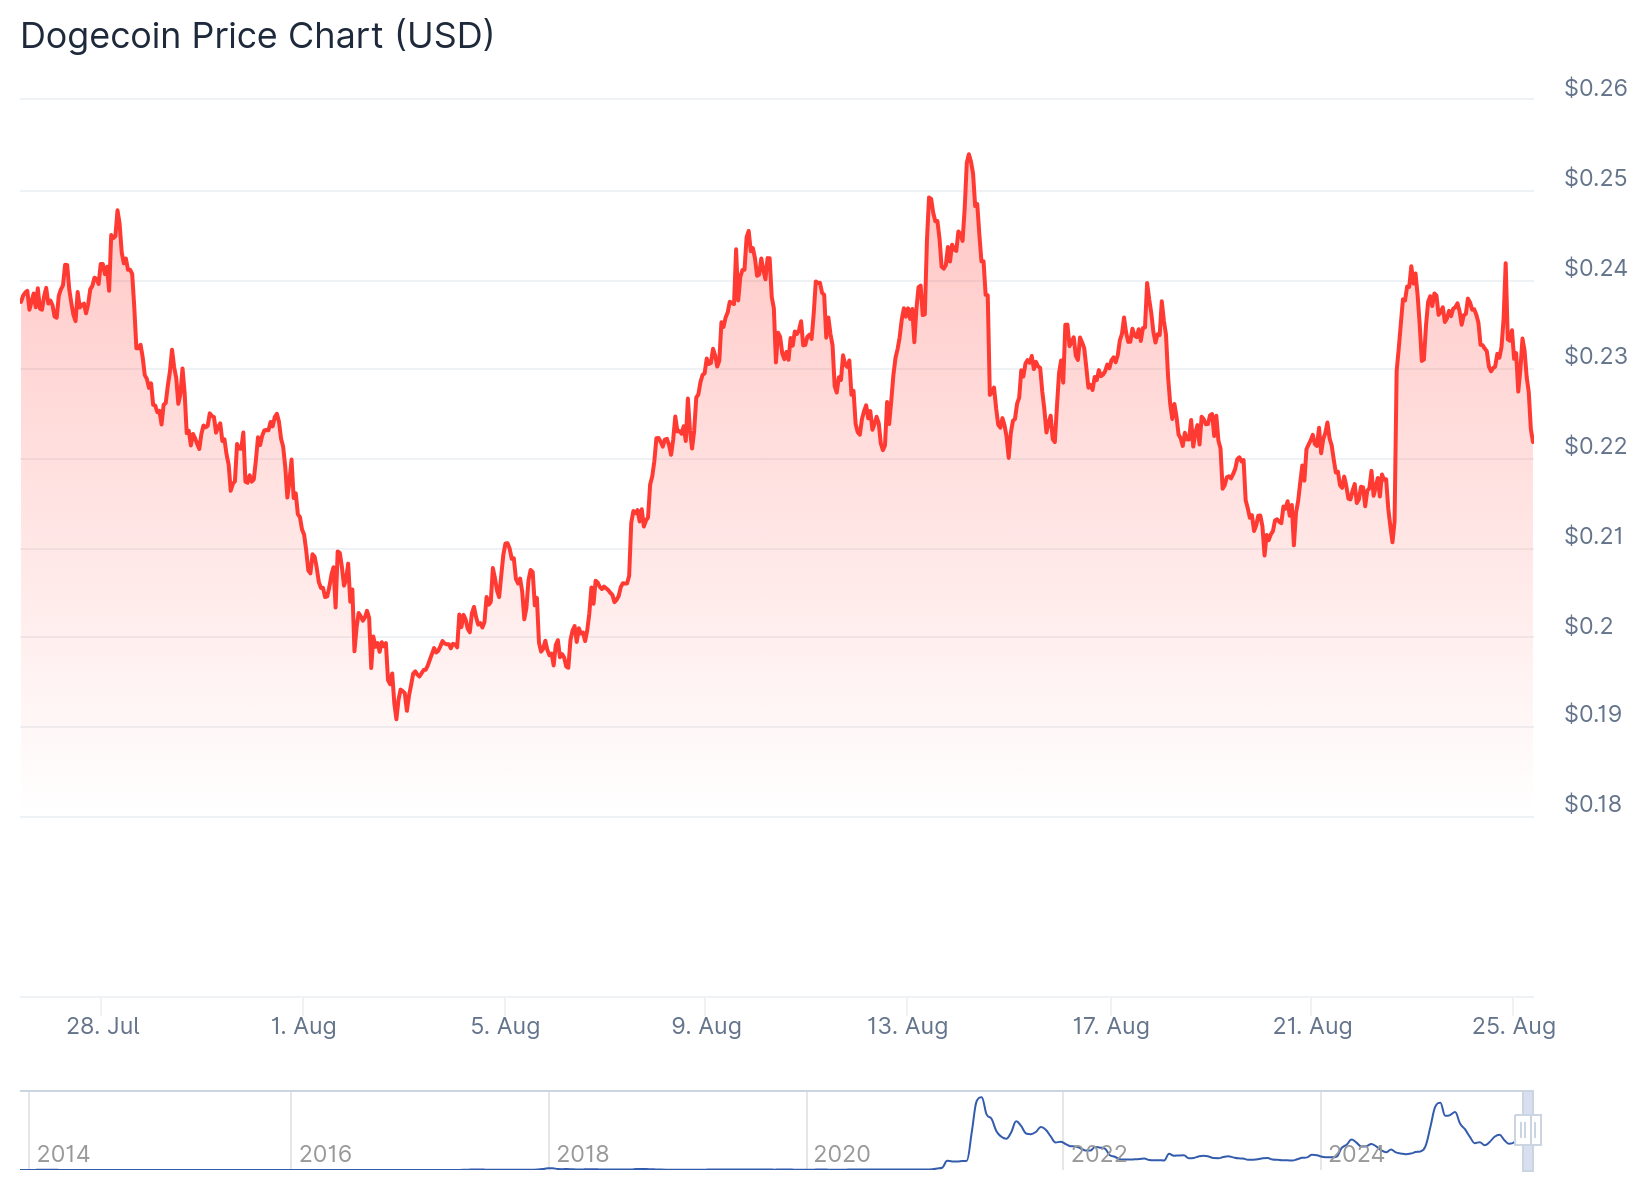
- Dogecoin trades near $0.23 forming symmetrical triangle pattern on 4-hour charts
- Key support established at $0.22 with resistance at $0.25 level
- Analysts project 30% upside move to $0.31 target if breakout confirms
- Trading volume hits $3 billion as price action compresses toward decision point
- Elliott Wave analysis suggests correction phase ending before potential uptrend
Dogecoin price action has captured analyst attention as the meme cryptocurrency forms a textbook symmetrical triangle pattern. Trading near $0.23, DOGE has declined 4% in the past 24 hours while remaining flat on weekly timeframes.
The technical formation shows converging trendlines creating a compression zone. The upper boundary connects recent swing highs while the lower trendline follows swing lows, creating the classic triangle shape.
Trading volume reached $3 billion during this consolidation period. This level indicates sustained interest despite the sideways price movement.
Crypto analyst Ali Martinez highlighted the pattern’s potential for a breakout move. His analysis suggests DOGE could target $0.30, representing approximately 30% gains from current price levels.
Triangle Pattern Approaches Critical Decision Zone
The symmetrical triangle typically resolves with a breakout in either direction. Martinez notes there may be “one last dip before the breakout” as price tests the pattern’s lower boundary.
Support has formed at $0.22, which represents a crucial level for bulls to defend. The resistance zone sits near $0.24-$0.25, where multiple rejection attempts have occurred.

Chart analyst Umair emphasizes the importance of the $0.25 resistance level. He states that breaking above this zone could lead to $0.31, while failure might send DOGE back to $0.21 or $0.1949.
A confirmed breakout requires closing above $0.25 with increased volume. This would validate the bullish scenario and open the path toward higher targets at $0.26, $0.28, and $0.31.
The Relative Strength Index currently reads 57, indicating neutral momentum. This suggests the asset isn’t overbought or oversold, leaving room for movement in either direction.
Dogecoin Price Prediction
Technical analyst Trader Tardigrade applied Elliott Wave Theory to DOGE’s daily chart. The analysis identifies a five-wave correction pattern labeled A through E, which appears to be nearing completion.
This wave structure typically precedes a “motive wave in uptrend” according to Elliott Wave principles. The pattern suggests the current correction phase may be ending before trend resumption.
Market sentiment remains mixed according to MarketProphit data. While general trader sentiment shows optimism, their analytical model maintains a cautious outlook.
Recent developments include Thumzup’s $50 million acquisition of Dogehash, creating what the company calls the largest Dogecoin mining operation. The Federal Reserve has also softened its stance on cryptocurrency banking regulations.
The triangle pattern requires confirmation through sustained closes above resistance levels. Traders are monitoring volume and price action for signals of the next directional move as DOGE approaches the apex of its formation.
Get 3 Free Stock Ebooks
Discover top-performing stocks in AI, Crypto, and Technology with expert analysis.
- Top 10 AI Stocks - Leading AI companies
- Top 10 Crypto Stocks - Blockchain leaders
- Top 10 Tech Stocks - Tech giants

