TLDR
- Dogecoin confronts $2.22 billion in supply at $0.21 where 10.5 billion coins were accumulated based on Glassnode cost-basis data
- Price holds above 2-year moving average at $0.17, matching historical patterns that preceded previous major rallies in 2017, 2020, and 2021
- Analyst targets $0.29, $0.45, and $0.86 if bulls break through the $0.21 resistance zone with sufficient volume
- Large holders show no signs of distribution as top 1% addresses maintain elevated supply concentration
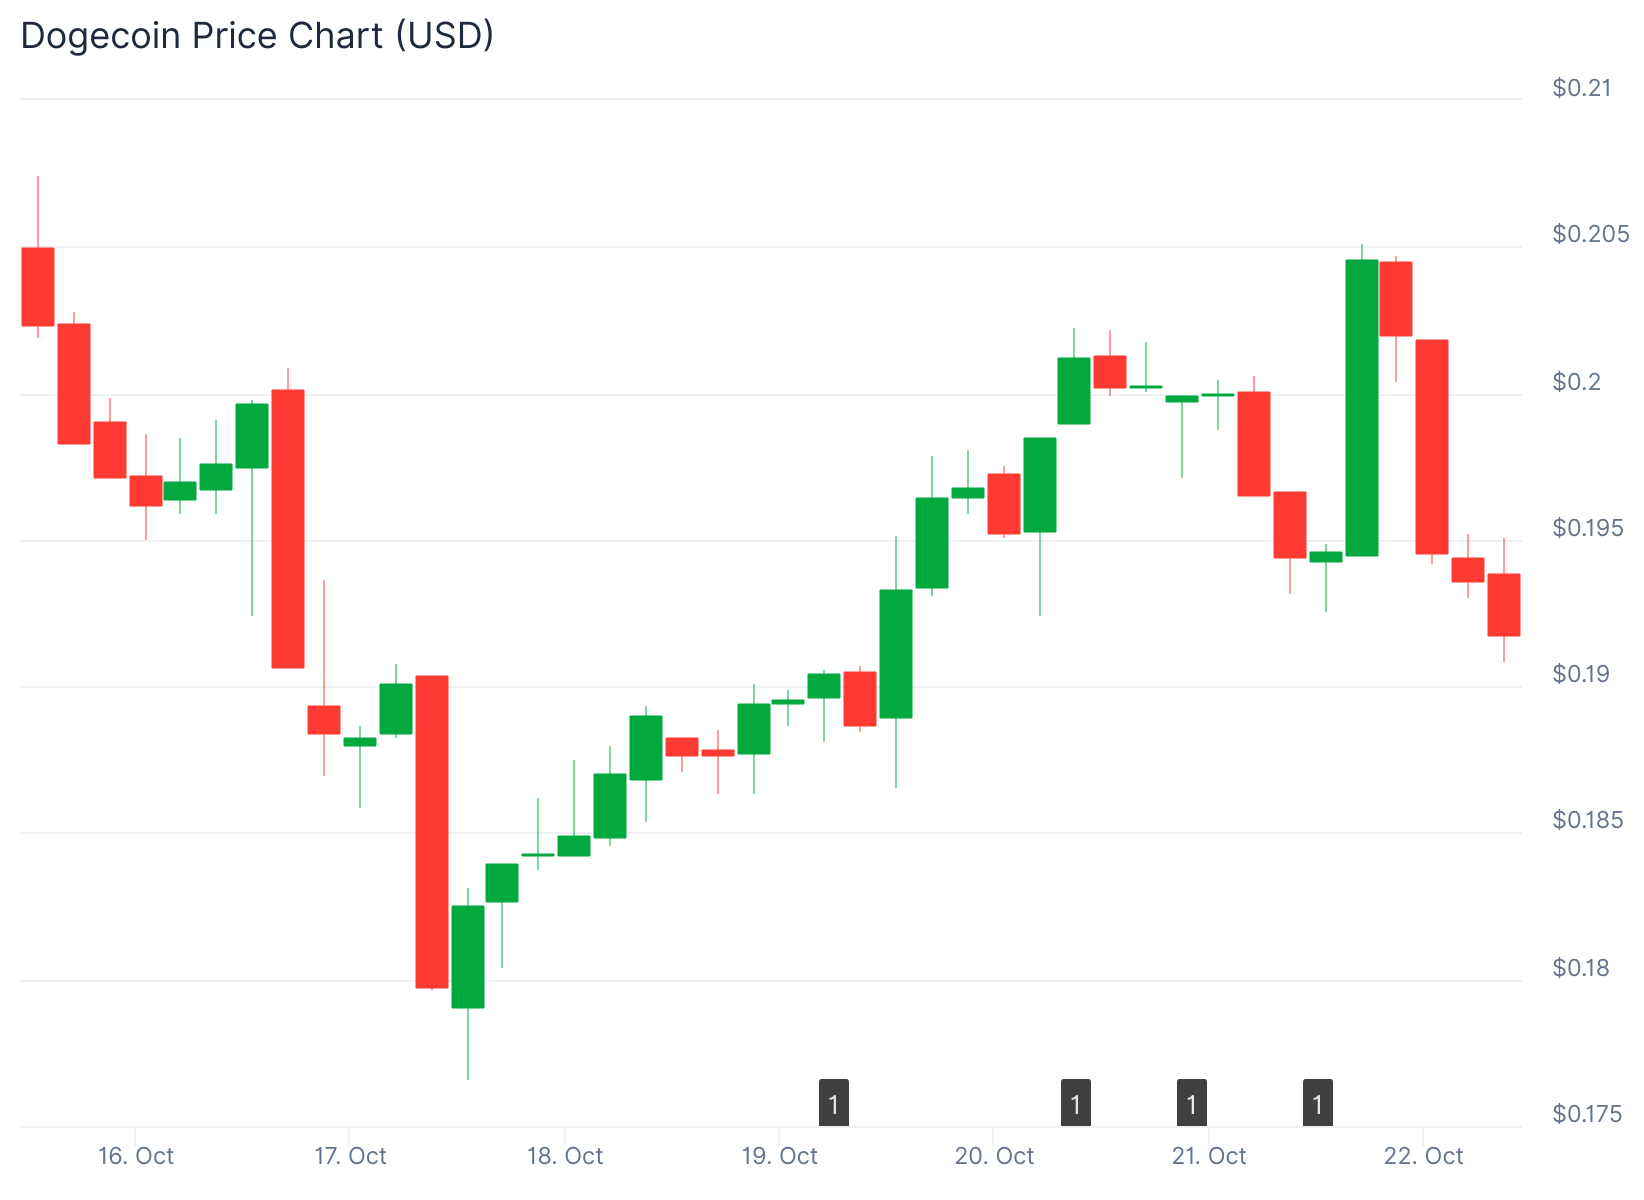
- Current trading price sits at $0.195, just below the critical resistance level
Dogecoin is trading at a critical juncture as on-chain data reveals a massive supply cluster at the $0.21 level. Glassnode’s cost-basis distribution shows 10.5 billion DOGE coins accumulated in this zone.

Market analyst Ali Martinez highlighted this concentration as a major resistance area. The exact cost basis range spans from $0.21062334 to $0.21144839, with total supply of 10,575,420,761 DOGE clustered there.
At $0.21, this represents approximately $2.22 billion worth of supply. Holders who accumulated at this level may look to exit at break-even, creating selling pressure.
The current price sits at $0.195, just below this resistance zone. Martinez noted that Dogecoin recently bounced off channel support and appears positioned for upward movement.
His technical analysis identifies three potential targets if resistance breaks. First comes $0.29, then $0.45, and finally $0.86. These align with Fibonacci extension levels within an ascending price channel.
Historical Support Level Remains Intact
Dogecoin trades above its 2-year moving average, currently near $0.17. This technical position mirrors setups seen before the coin’s largest rallies.
Analyst Surf points out that DOGE consolidated above this moving average in 2017 and 2020 before surging. The 2021 rally that reached above $0.70 followed the same pattern.
The 2-year moving average serves as both support and a gauge of long-term buyer confidence. Historical data shows sustained periods above this line preceded multi-month bullish phases every time.
The $0.21 area also intersects with the 0.618 Fibonacci retracement at approximately $0.21205. This overlap of technical resistance and realized-price concentration explains why price has stalled here.
Whale Accumulation Continues
On-chain metrics from analyst Cryptollica show large holders maintaining their positions. Data tracking the percent of supply held by top 1% addresses reveals no downward trend.
The analyst noted that distribution has not begun despite price moving higher. The top 1% cohort holds an elevated and recently rising share of total supply.
This concentration suggests large addresses remain committed to their holdings. The absence of distribution reduces evidence of heavy selling from whales.
While concentration can amplify price moves when large holders rotate positions, current data shows stability. This indicates conviction among the largest stakeholders.
The bullish structure depends on price staying above the $0.17 to $0.18 zone where the 2-year moving average provides support. Immediate resistance sits between $0.25 and $0.30.
Breaking above $0.25 could trigger momentum toward $0.30 to $0.35. This would shift market dynamics from accumulation to expansion.
The three data sources create a clear picture. Cost-basis data identifies concentrated supply at $0.21 where price currently struggles. Technical analysis marks this same zone as Fibonacci resistance within an established upward channel.
Large holder metrics show no sign of distribution, supporting the case for potential upside if bulls can absorb the $2.2 billion in supply at resistance.
If the $0.21 level flips to support, Martinez’s mapped targets at $0.29, $0.45, and $0.86 provide a roadmap for potential price movement. The channel structure has guided price action across multiple tests since 2023.
At press time, DOGE traded at $0.195 while maintaining position above the 2-year moving average support level.


