
 Faces Potential Drop to $1,800 as Price Struggles at $2,000 Support")
Key Takeaways
- Ethereum remains vulnerable near $2,000 following a rejection at the $2,372 level earlier in March.
- Long/short positioning has swelled to 2.4, creating potential for a leveraged long squeeze if support fails.
- Ethereum ETFs experienced $92.5 million in net redemptions on March 26.
- A massive $14.16 billion Bitcoin options expiration event contributed to broader market weakness.
- Critical resistance stands at $2,138–$2,151, while a breakdown below $1,980 could trigger a move toward $1,800.
Ethereum is currently hovering around the $2,048 mark as buyers attempt to defend the psychologically important $2,000 threshold. After climbing earlier this month, ETH encountered strong resistance near $2,372 and has since been confined to a consolidation pattern between $1,900 and $2,200.
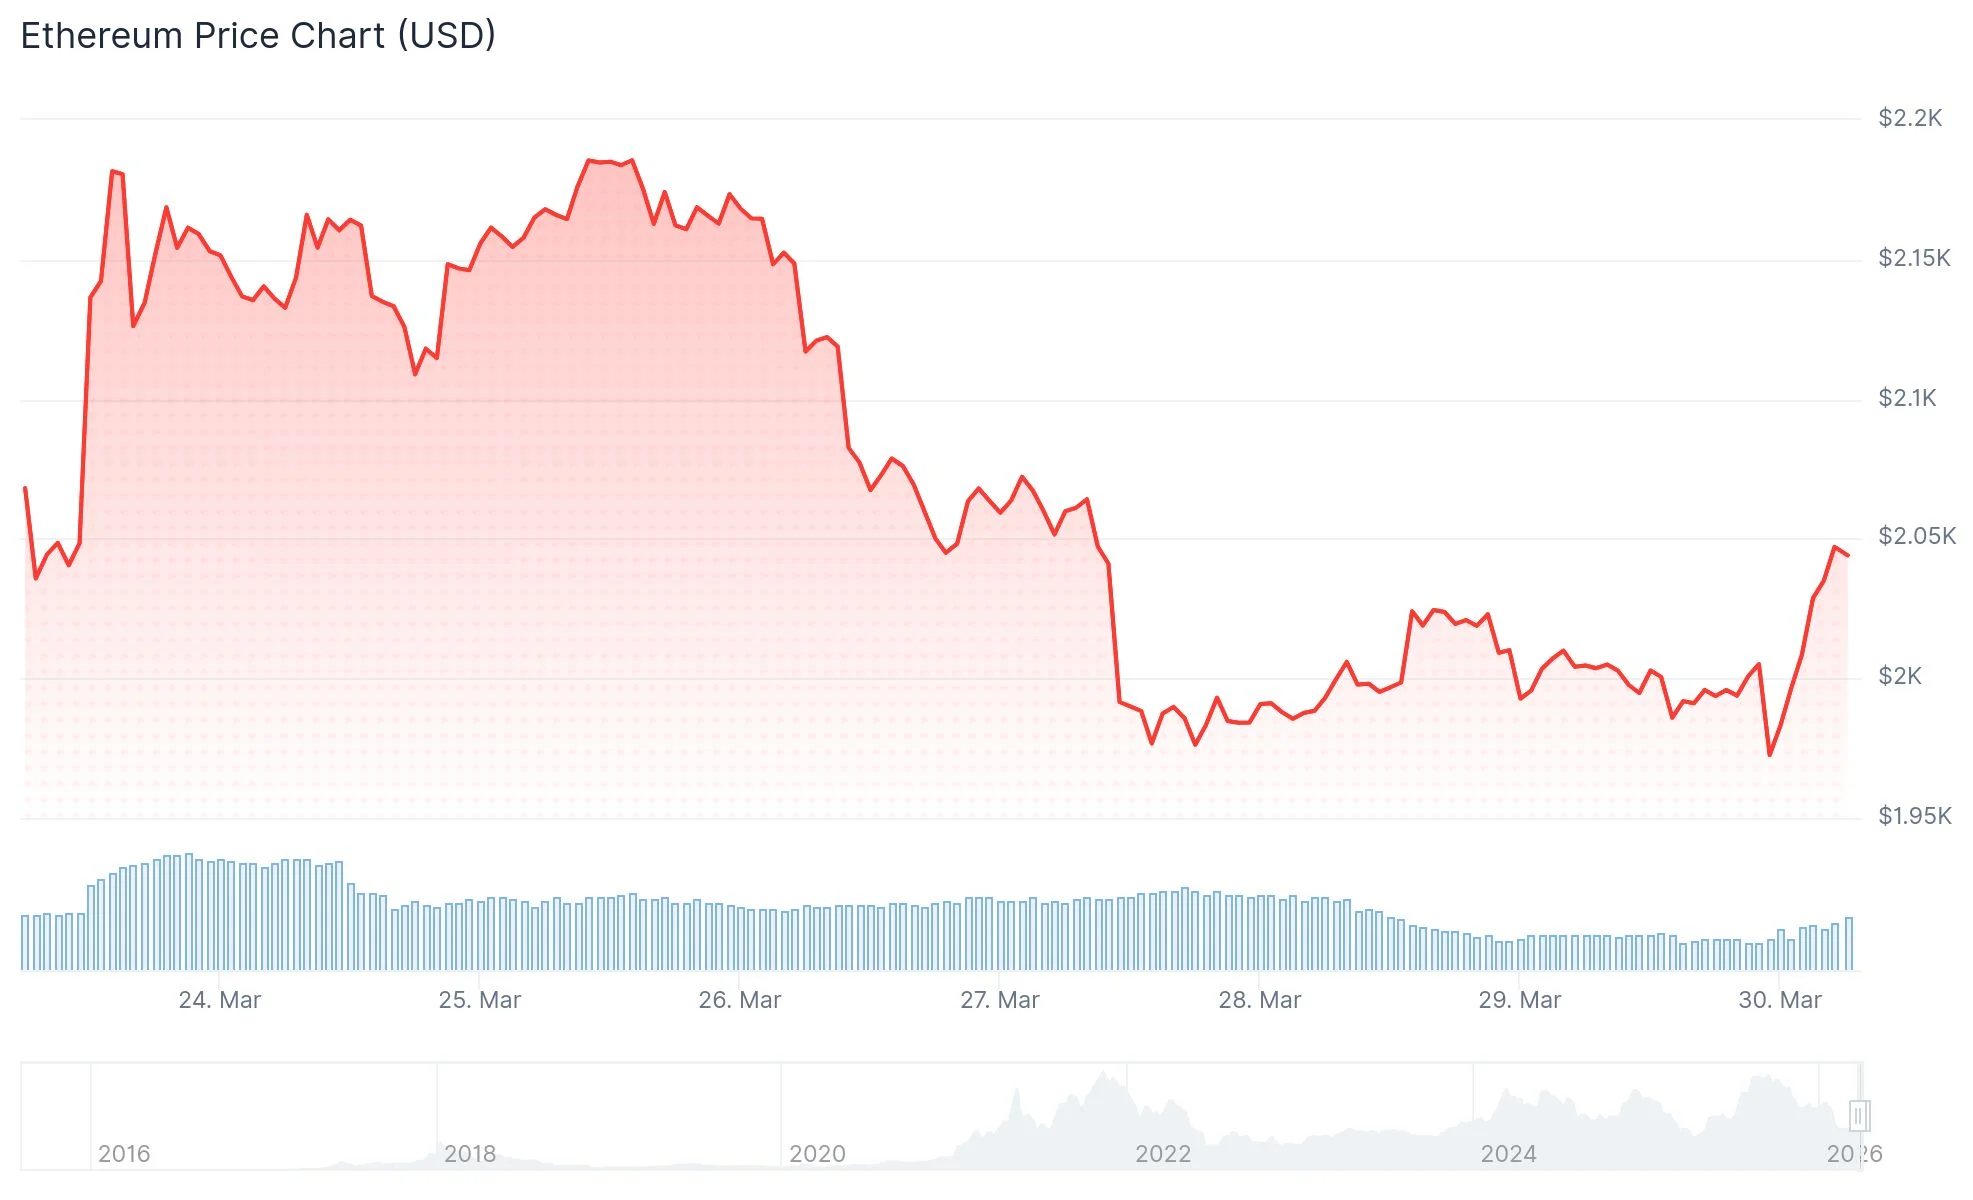
The digital asset remains trapped beneath its 50-day exponential moving average, which currently hovers around $2,160, and significantly below the 100-day EMA positioned near $2,420. This configuration suggests a bearish technical structure remains intact.
Daily chart momentum indicators paint a concerning picture. The Relative Strength Index registers approximately 44, falling short of the neutral 50 threshold. Meanwhile, the MACD indicator trades beneath its signal line while drifting toward the zero line. These technical signals collectively suggest weakening bullish conviction.
A particularly noteworthy development is the expansion in the long/short ratio to approximately 2.4. This metric indicates that bullish-positioned traders significantly outnumber their bearish counterparts. However, price action hasn’t reflected this optimistic positioning.
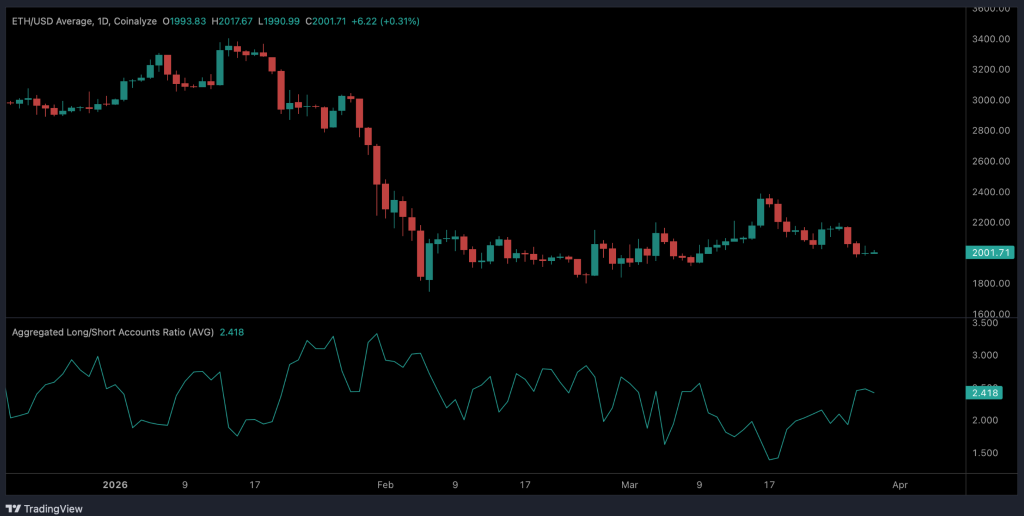
This divergence between positioning and price creates a precarious situation. When leveraged long positions accumulate without corresponding upward movement, the market becomes vulnerable to what’s known as a long squeeze—a cascading liquidation event where forced selling by overleveraged bulls accelerates downward momentum.

Institutional Flows and Broader Market Dynamics
U.S.-based Ethereum exchange-traded funds registered $92.5 million in net outflows on March 26, reflecting diminishing institutional appetite. These redemptions occurred against a backdrop of widespread crypto fund withdrawals.
The preceding day saw an unprecedented $14.16 billion in Bitcoin options contracts reach expiration on March 27. Such substantial derivatives events frequently inject volatility into digital asset markets, and this instance contributed to selling momentum across the crypto ecosystem.
External macroeconomic factors compounded these pressures. Escalating crude oil prices, driven by Iran’s threats to disrupt critical maritime shipping lanes, reignited inflation anxieties. Such environments typically disadvantage risk-on assets, including Ethereum and other cryptocurrencies.
Critical Price Zones and Technical Outlook
Looking at upside targets, the $2,138 level represents the 23.6% Fibonacci retracement calculated from the recent swing high of $3,402 to the low of $1,747. The Ichimoku Kijun line intersects at $2,151, and a decisive close above this resistance cluster could open the path toward $2,380.
On the support side, $1,990 serves as the immediate floor. Should this level fail, attention shifts to the channel bottom near $1,748. A confirmed breach of this zone would likely extend the bearish trajectory.
Technical projections for the upcoming week suggest consolidation between $1,980 and $2,170, with probability models assigning less than a 20% chance of meaningful upside movement during this period.
Market analyst Ali Charts highlighted on social media platform X that Ethereum confronts a “major test at $1,800,” indicating that some technical observers view substantially lower price levels as viable if current support structures collapse.
In contrast, analyst Tom Lee has projected a long-term price target of $62,000 for Ethereum, though this forecast lacks a specific timeframe and represents a bullish outlier perspective.
With Ethereum ETF redemptions reaching $92.5 million on March 26 and ETH consolidating near $2,000, technical momentum indicators suggest continued near-term vulnerability for the second-largest cryptocurrency by market capitalization.
Get 3 Free Stock Ebooks
Discover top-performing stocks in AI, Crypto, and Technology with expert analysis.
- Top 10 AI Stocks - Leading AI companies
- Top 10 Crypto Stocks - Blockchain leaders
- Top 10 Tech Stocks - Tech giants

