
 Price: $9.5 Billion Short Squeeze Setup Points to Major Rally")
TLDR
- Ethereum price bounced back above $4,000 following institutional buying from major firms
- Current trading level around $4,100 represents a 7.8% daily increase with strong volume
- Short squeeze potential exists with $9.5 billion in positions at risk if price rises 20%
- Key resistance levels identified at $4,300 and $4,400 with support holding at $4,150
- Market analysts project potential move to $7,000 by May 2026 based on current trends
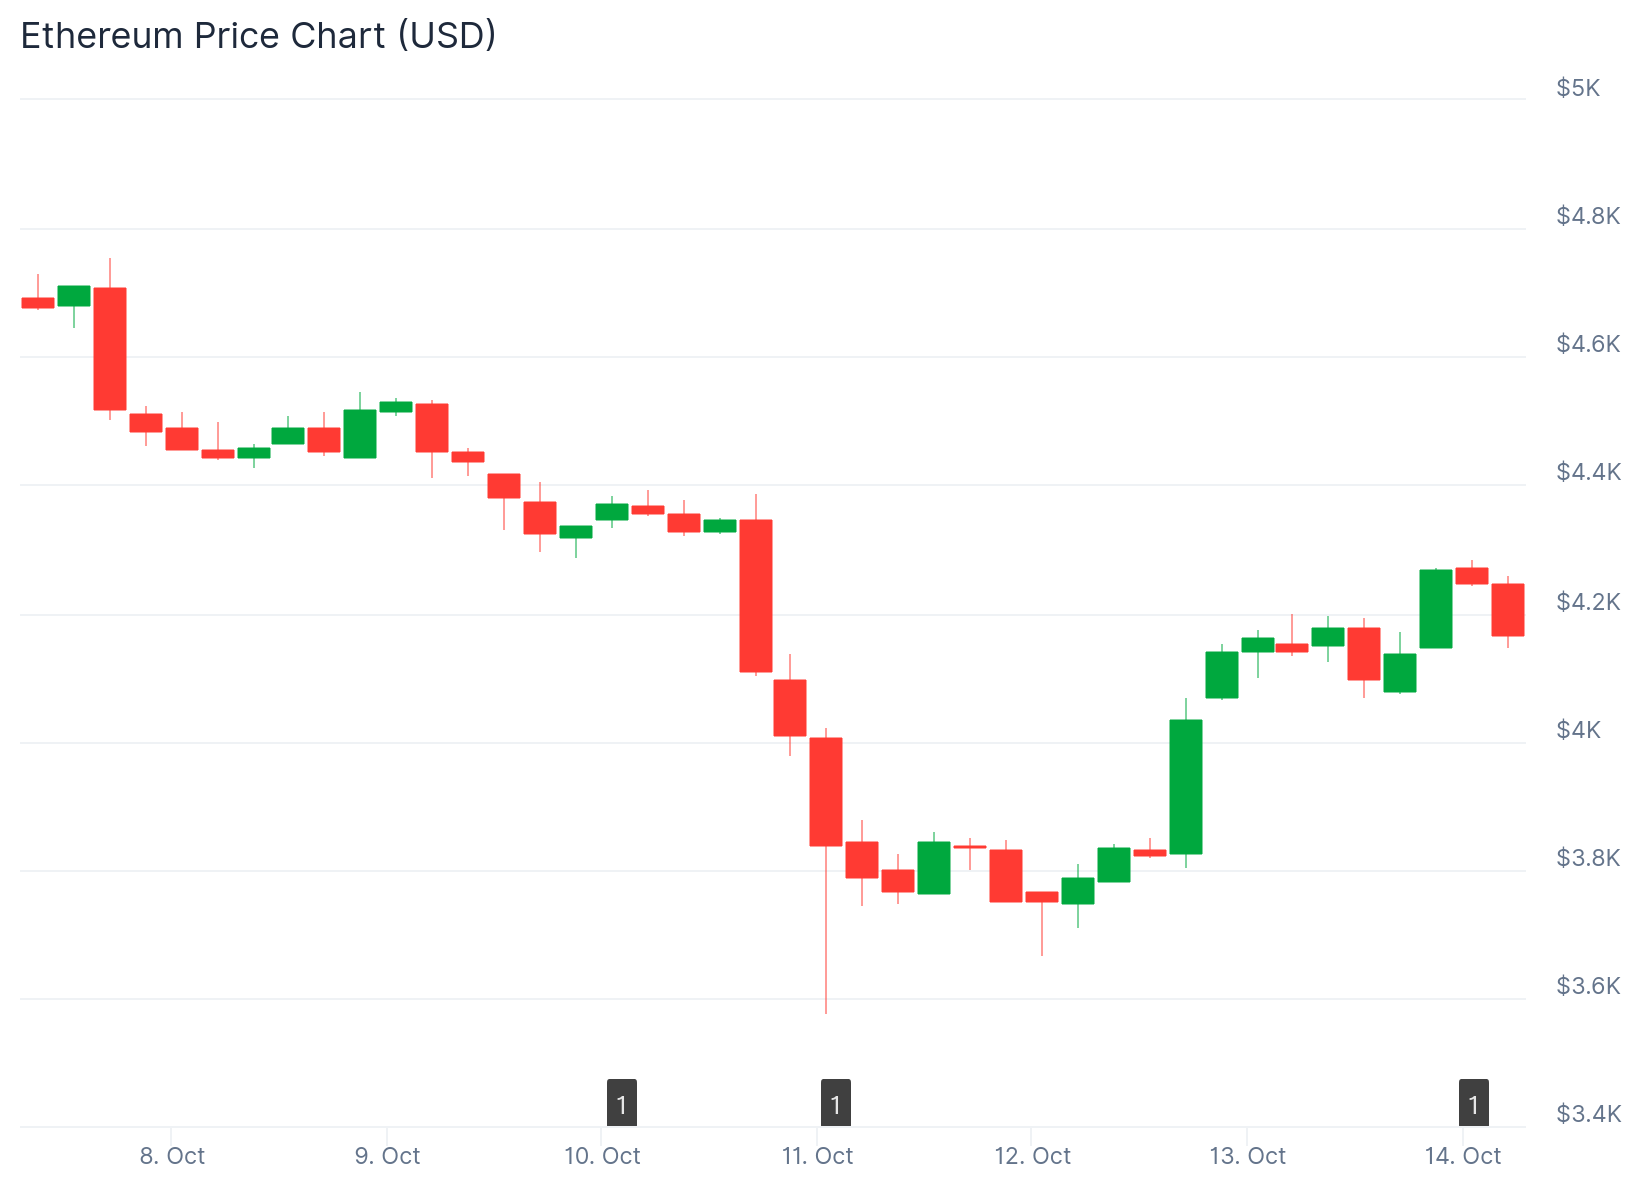
Ethereum has completed a recovery move that pushed the cryptocurrency back above the $4,000 threshold. The asset is currently trading near $4,100 after climbing from recent lows.
The recovery followed a period where institutional investors entered the market. Major financial firms including BlackRock and Vanguard reportedly purchased ETH during the price weakness.
Market observer Mike Investing noted that these institutions accumulated large positions below $4,000. His analysis suggests Ethereum could climb to $7,000 by May 2026 if momentum continues.
The cryptocurrency cleared multiple technical barriers during its ascent. ETH moved past the $4,000 and $4,120 levels while forming a base above $3,850.
Market Structure and Liquidity
Trading data shows an asymmetric risk profile in current positioning. Approximately $9.5 billion in short positions would face liquidation with a 20% price advance.
Conversely, long positions totaling $2.6 billion are at risk with a 20% decline. This setup favors upward movement according to analyst TedPillows.

Liquidation heat maps indicate concentrated short exposure between $4,800 and $5,000. A breakout above these zones could accelerate price gains through forced covering.
The 24-hour trading volume reached $59.2 billion. The hourly MACD indicator shows positive momentum while the RSI sits above 50.
Technical Price Levels
A bullish trend line has formed with support at $4,150 on hourly charts. The price is trading above its 100-hour moving average.
Immediate resistance appears at $4,250 followed by a more substantial barrier at $4,400. The 76.4% Fibonacci retracement level aligns with resistance near $4,440.
A sustained break above $4,400 could open the path toward $4,500. Further gains might extend to $4,550 or $4,650 in the near term.
Downside support begins at $4,150 and the trend line. The first major support zone sits at $4,120.
Market Dynamics
Some traders are monitoring short-term patterns for potential pullbacks. Technical analyst SailorManCrypto identified a three-drive formation with bearish divergence on lower timeframes.
The $3,900 to $4,000 range represents a key demand zone. This area could provide support if the price retraces before continuing higher.
Ethereum’s staking ratio has increased steadily. This metric indicates supply is being removed from exchanges and locked in staking contracts.
The reduction in available supply combined with ETF inflows supports the bullish price outlook. Institutional participation continues to expand across multiple investment vehicles.
If current support levels hold and accumulation persists, analysts expect the next major resistance around $5,700. Beyond that level, the $7,000 target becomes the focal point.
Ethereum maintains its position above $4,100 with improving technical indicators. The combination of institutional interest and favorable market structure suggests continued strength.
Get 3 Free Stock Ebooks
Discover top-performing stocks in AI, Crypto, and Technology with expert analysis.
- Top 10 AI Stocks - Leading AI companies
- Top 10 Crypto Stocks - Blockchain leaders
- Top 10 Tech Stocks - Tech giants

