
 Price Analysis: Critical Support Zones After Recent 8% Decline")
Key Takeaways
- Jeffrey Wilcke, an Ethereum co-founder, moved 79,176 ETH (approximately $157M) to Kraken, triggering market concerns
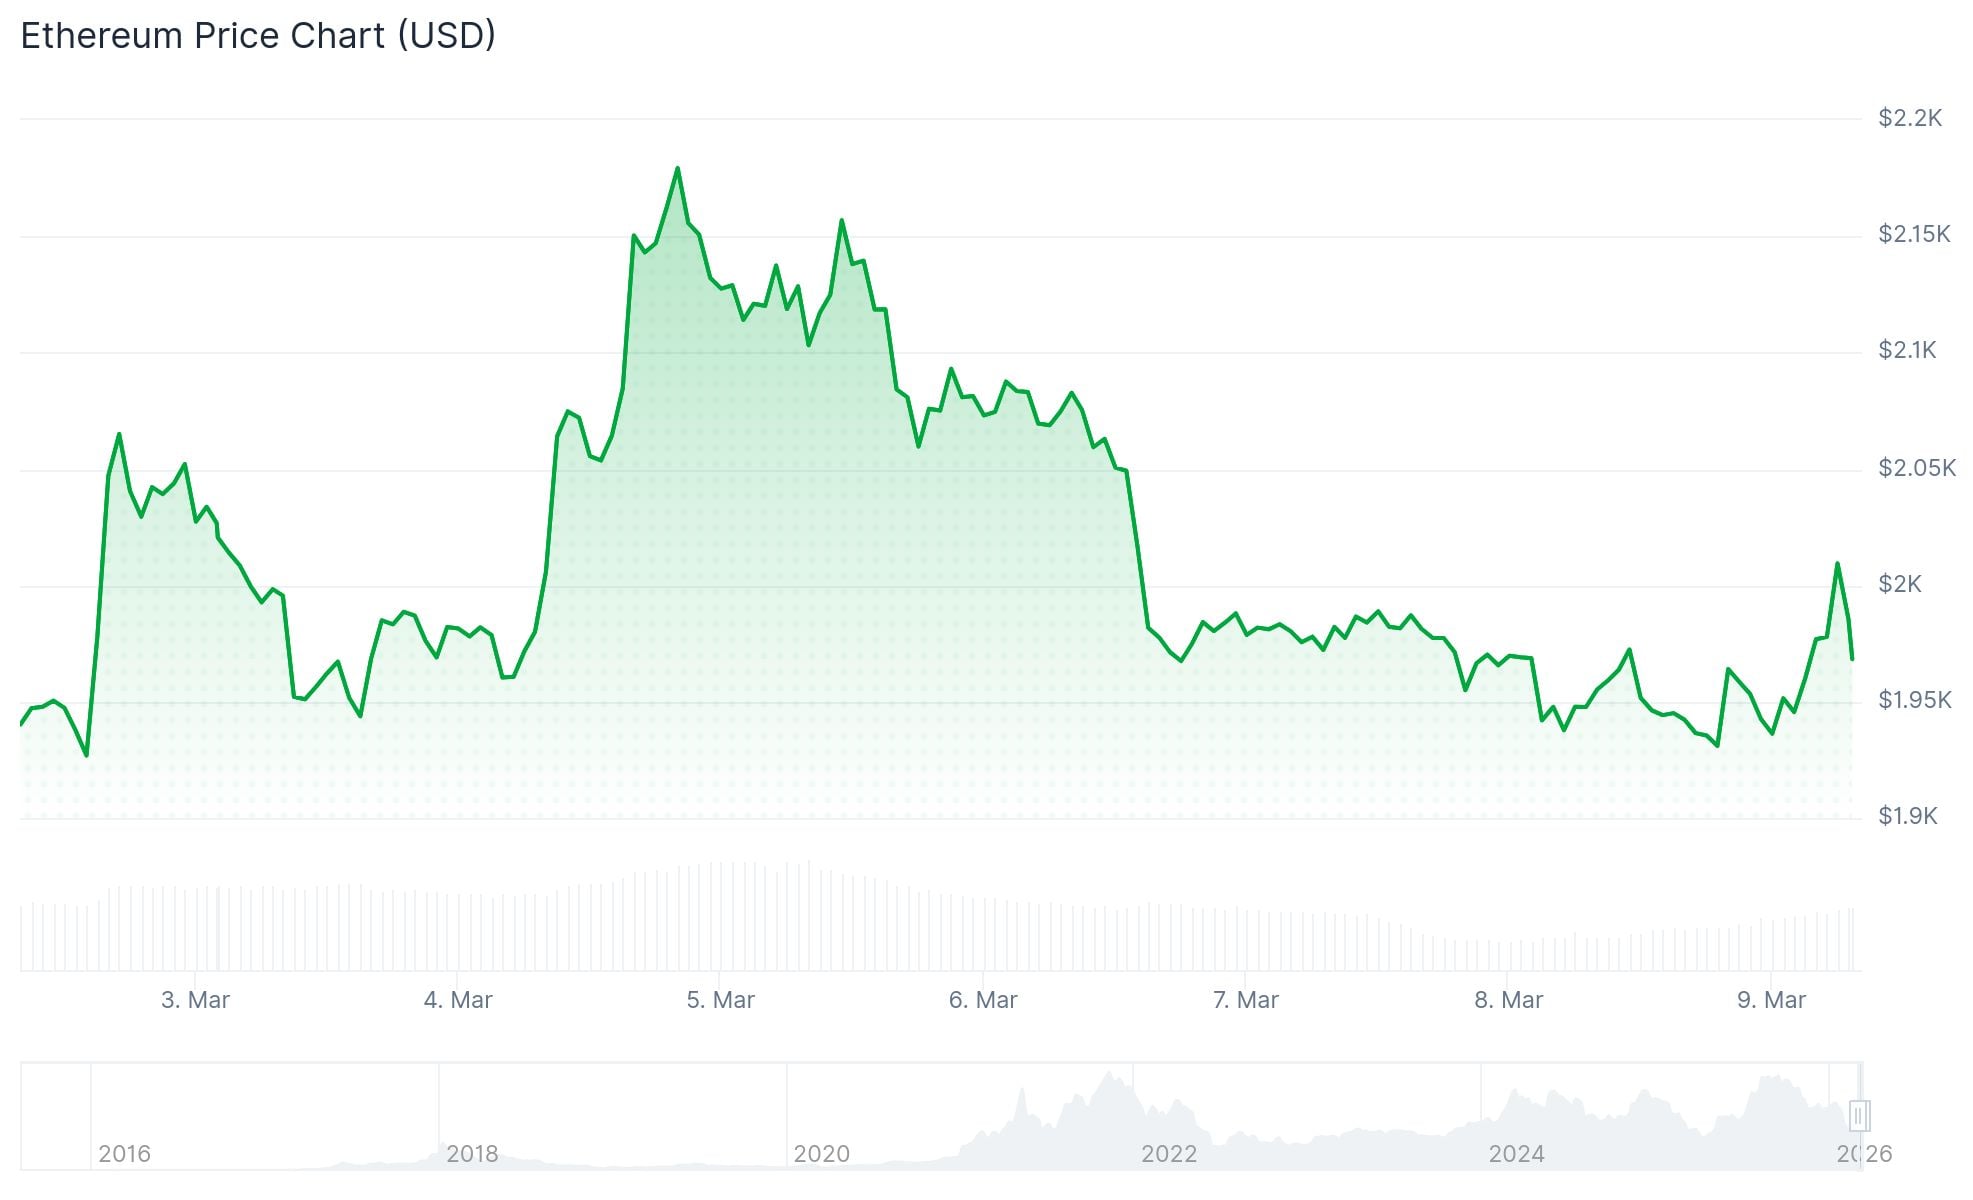
- ETH has declined nearly 8% from March 6, touching lows around $1,912
- Current trading remains beneath the $2,000 mark and the 100-hourly Simple Moving Average
- Whale cohorts holding 100K–10M ETH are showing accumulation behavior amid the downturn
- Critical support zone established between $1,900–$1,920; failure could push toward $1,800
Since March 6, Ethereum has faced significant downward momentum, declining nearly 8% and now testing crucial support near the $1,900 threshold. The catalyst for this selloff was a substantial transaction by Jeffrey Wilcke, one of Ethereum’s co-founders, who transferred 79,176 ETH—valued at approximately $157 million—to the Kraken trading platform.
When substantial crypto holdings move to centralized exchanges, market participants typically interpret this as a signal of impending liquidation. This particular transfer created anxiety among traders and compounded the existing weakness in ETH’s price action.
The asset bottomed at $1,912 before establishing a consolidation pattern. Currently, as of March 9, ETH is changing hands below $1,980 and trading underneath the 100-hourly Simple Moving Average, suggesting continued near-term bearish pressure.
Large Holders Continue Accumulating Despite Market Fear
Between March 2 and March 6, Bitcoin spot ETFs saw aggregate net inflows totaling $568 million. During this identical timeframe, Ethereum spot ETFs attracted $23.56 million in net inflows, demonstrating persistent institutional appetite despite ETH’s recent price deterioration.
Interestingly, while Wilcke’s transfer sparked concern across the market, analysis reveals that not all major stakeholders are liquidating positions. Examination of wallet cohorts indicates that addresses controlling between 100,000 and 10 million ETH have been actively accumulating throughout this pullback.

This strategic buying from substantial market participants has established a support foundation, preventing a more dramatic price collapse. The current market dynamic reflects a battle between selling pressure from the co-founder’s exchange deposit and strategic accumulation by other institutional-scale investors.
The $1,920 price level has successfully defended against further declines in the immediate term. Should buyers successfully defend this zone, ETH could stage a recovery attempt toward $1,980, potentially challenging the psychological $2,000 barrier.
Above current levels, resistance zones are substantial and well-defined. The initial obstacle appears at $2,020, with a more significant barrier at $2,050—this level corresponds with the 50% Fibonacci retracement from the recent decline that took ETH from $2,200 down to $1,912.
Technical Indicators Signal Continued Weakness
The broader technical landscape paints a bearish picture. Virtually all major moving averages are positioned above the current trading range. The 200-period Exponential Moving Average stands at $2,899, while the 200-period Simple Moving Average sits at $3,324—both representing significant overhead resistance.
Near-term momentum indicators present a more balanced view. The Relative Strength Index registers 42.4, the Stochastic oscillator reads 40.4, and the Commodity Channel Index shows −47.7. The Average Directional Index measures 29.9, indicating a trend is developing but hasn’t reached extreme territory.
Should the $1,920 level fail to hold, attention shifts to the next support zone around $1,880. A breakdown below that threshold would bring the $1,800 area into focus—a price level where historical buying interest has emerged.
As of March 9, 2026, ETH was hovering near $1,939, continuing to trade beneath the $2,000 level that has proven resistant to multiple recovery attempts.
Get 3 Free Stock Ebooks
Discover top-performing stocks in AI, Crypto, and Technology with expert analysis.
- Top 10 AI Stocks - Leading AI companies
- Top 10 Crypto Stocks - Blockchain leaders
- Top 10 Tech Stocks - Tech giants

