
 Price: Bulls Fight to Hold Key Support as Bears Eye Drop to $3,600")
TLDR
- Ethereum trades below $4,220 and 100-hourly moving average after failing to sustain momentum above $4,500
- Bears control market with MACD showing bearish momentum and RSI dropping below 50 level
- Key support at $4,125 with potential drop to $3,560 representing 15% decline from current levels
- Resistance forms at $4,280-$4,370 with bearish trend line capping recovery attempts
- Long-term bullish targets remain at $8,400 if technical breakout above resistance occurs
Ethereum price continues to face downward pressure as the cryptocurrency struggles to maintain gains above key technical levels. ETH is currently trading below $4,220, marking a retreat from recent highs near $4,500.
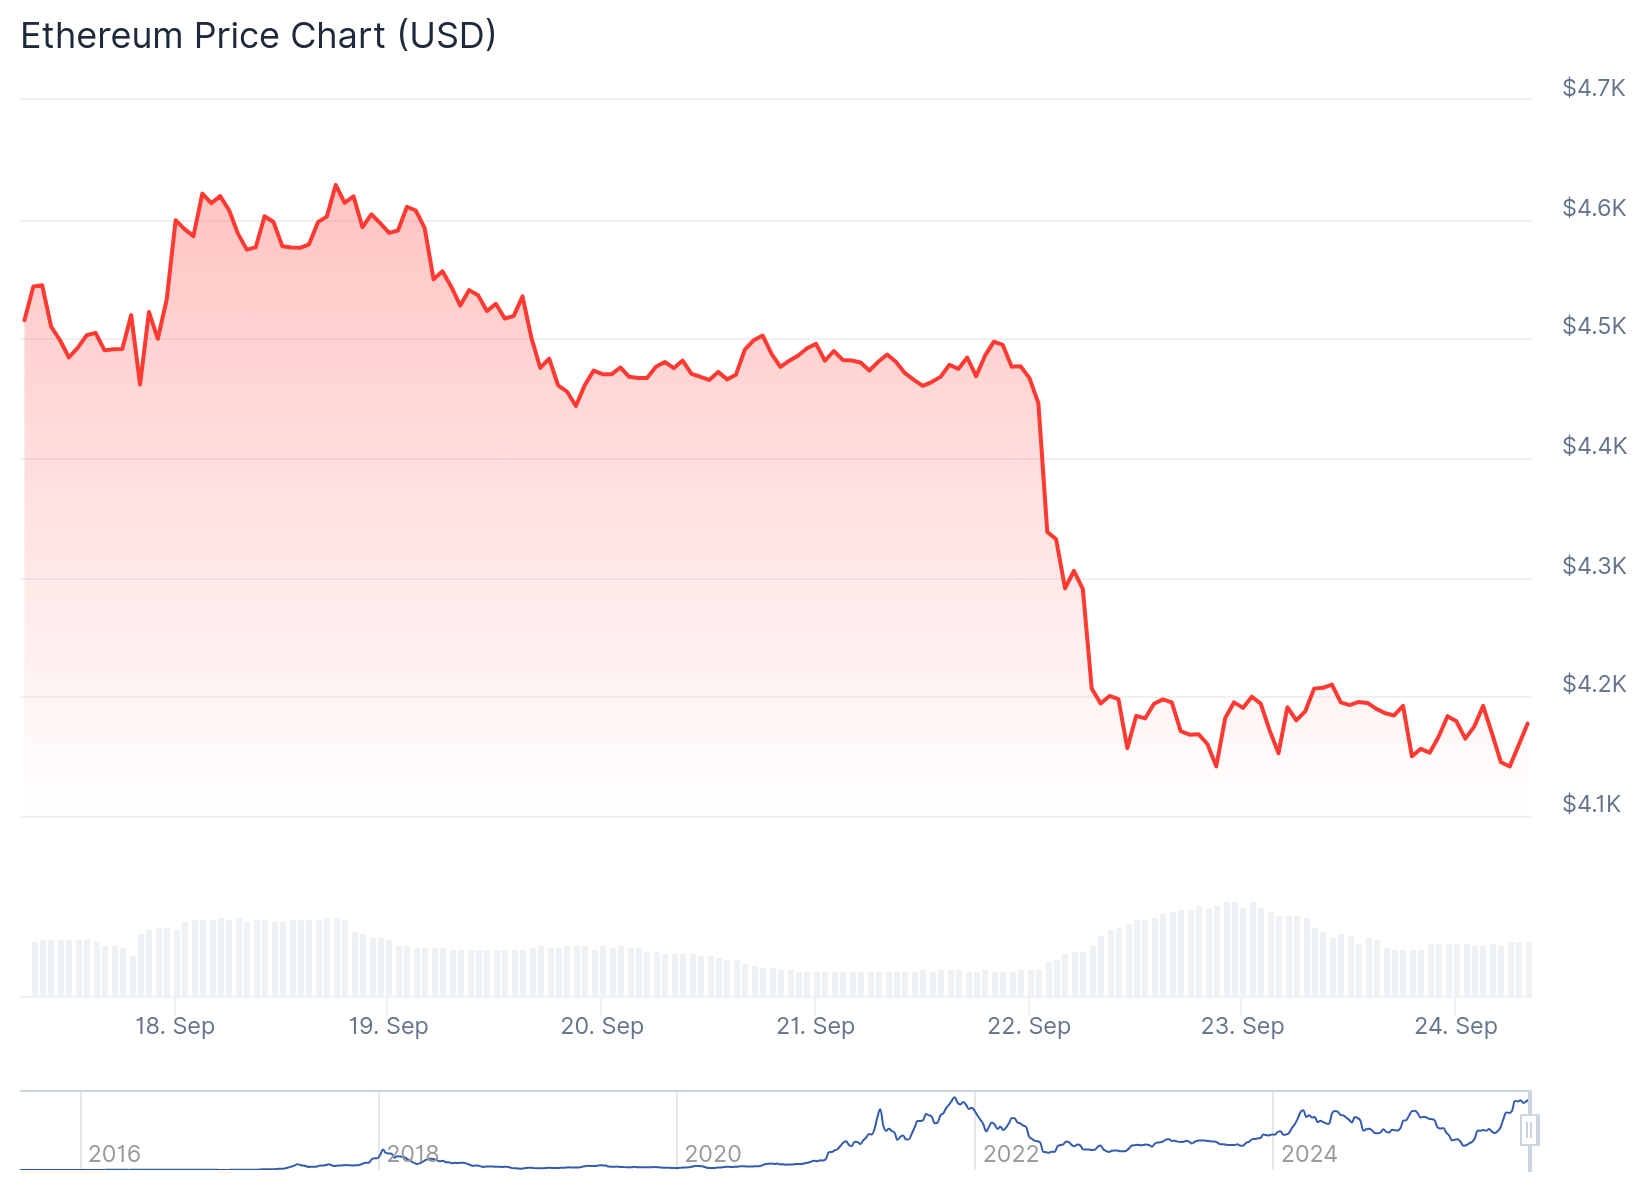
The second-largest cryptocurrency has broken below critical support zones at $4,420 and $4,350. This decline pushed ETH to test the $4,000 level before a minor recovery wave began.
Technical indicators paint a bearish picture for near-term price action. The hourly MACD is gaining momentum in negative territory while the RSI has fallen below the important 50 threshold.
ETH now trades beneath its 100-hourly Simple Moving Average, a key indicator that often signals continued weakness. The price structure shows bears have taken control after bulls failed to extend gains.
A bearish trend line has formed with resistance positioned at $4,370. This technical pattern represents a major obstacle for any potential recovery attempts in the coming sessions.
Support and Resistance Levels Define Trading Range
The immediate resistance for Ethereum sits at $4,220, followed by the next barrier at $4,280. These levels must be cleared for bulls to regain momentum and challenge higher targets.

Major resistance is located near $4,315, which aligns with the 50% Fibonacci retracement of the recent decline. A break above this level could open the door to $4,370 resistance.
However, failure to overcome these resistance zones increases the risk of deeper losses. The first support level to watch is $4,125, which could determine the next directional move.
If this support fails, ETH could decline toward $4,050 and potentially test the $4,000 psychological level again. Further weakness might push the price to $3,880 in the near term.
Analysts Warn of Extended Correction Phase
Market analysts are pointing to compression building in Ethereum’s price structure. This technical setup often precedes large directional moves in either direction.
Crypto analyst Michaël van de Poppe expects ETH to slide into the $3,550-$3,750 range over the coming weeks. This projection represents a correction of approximately 15% from current price levels.
The breakdown from a symmetrical triangle pattern has shifted short-term sentiment to bearish. The measured move from this formation targets $3,560 as a potential landing zone.
Despite near-term weakness, some technical analysts maintain longer-term bullish outlooks. The recent breakout above $4,100 resistance after multiple failed attempts suggests underlying strength.
This breakout was confirmed when the level successfully held as support during a retest. Such price action often indicates a shift from resistance to support, creating a foundation for future gains.
Chart projections based on this technical development point toward much higher targets at $6,000 and $8,400. These levels represent the potential upside if bulls can regain control and push through current resistance.
ETH remains supported by a rising trend line that has been in place since April. This trend line has historically preceded rallies ranging from 90% to 125% in previous market cycles.
The cryptocurrency faces a critical juncture as it tests key support at $4,125 while dealing with increased selling pressure and bearish momentum indicators.
Get 3 Free Stock Ebooks
Discover top-performing stocks in AI, Crypto, and Technology with expert analysis.
- Top 10 AI Stocks - Leading AI companies
- Top 10 Crypto Stocks - Blockchain leaders
- Top 10 Tech Stocks - Tech giants

