
 Price: Could $11 Billion in Shorts Spark The Next Major Rally")
TLDR
- Ethereum trades at $4,054 with over $11 billion in shorts facing liquidation above $4,200
- Price recovered from $3,812 low as bearish sentiment creates potential squeeze setup
- Technical indicators show bullish divergence and break above key trend line resistance
- Fear and Greed Index improved from extreme fear levels during weekend recovery
- Smart money may target liquidation zones where forced buying could fuel further gains
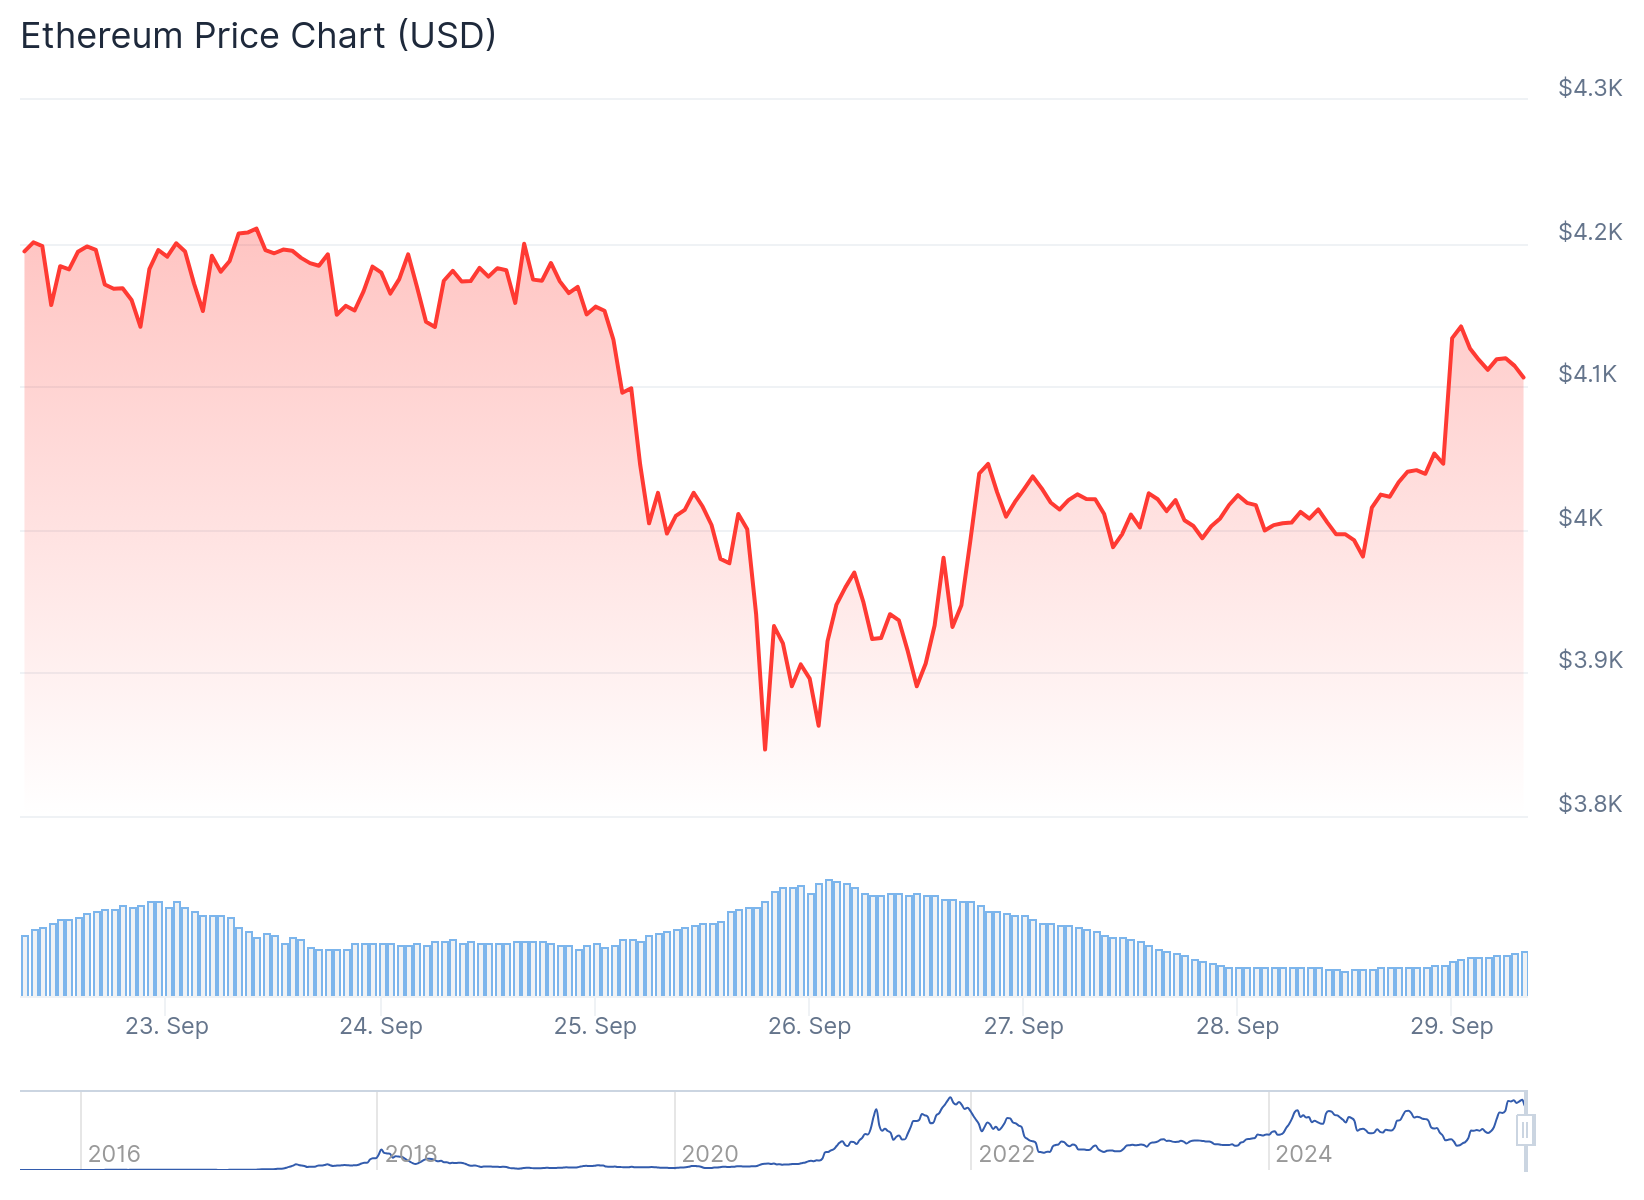
Ethereum price action shows promising recovery signals after bouncing from last week’s decline to $3,812. The world’s second-largest cryptocurrency now trades at $4,054, approaching a critical resistance level that could trigger massive liquidations.
Data from Coinglass reveals more than $11 billion worth of short positions face liquidation above the $4,200 price threshold. This creates conditions for a potential short squeeze event if ETH breaks through this resistance zone.
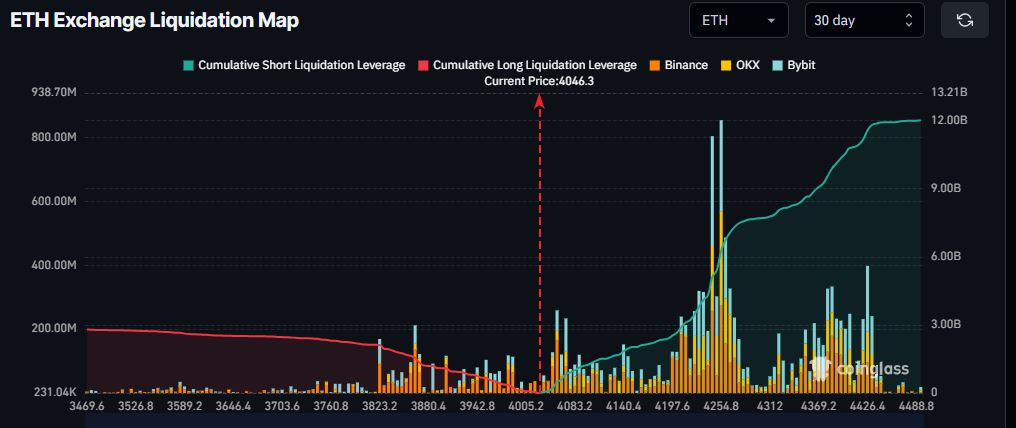
Short squeezes occur when traders betting against price increases get forced to buy back positions. The resulting buying pressure often accelerates upward price movements.
Current positioning reflects widespread bearish expectations among market participants. Many traders anticipated Ethereum would continue declining toward the $3,380 support level.
Sentiment Indicators Signal Potential Reversal
Market sentiment reached extreme pessimism last Friday when the Fear and Greed Index dropped to 28. This reading approaches maximum fear territory and typically indicates oversold conditions.
However, sentiment metrics improved over the weekend, coinciding with Ethereum’s price recovery above $4,000. The bounce suggests potential buying interest at lower levels.

Additional liquidation data shows approximately 25,790 ETH worth of leveraged shorts on Hyperliquid face liquidation at $4,058. This represents roughly $104.6 million in at-risk positions.
Ethereum ETF outflows contributed to last week’s selling pressure. Any recovery in institutional demand through ETF products could support continued price gains.
Net spot flows currently favor outflows by about $10 million, indicating large holders remain cautious about the recovery’s sustainability.
Technical Analysis Supports Bullish Case
Technical indicators align with potential continued upside movement. Ethereum successfully broke above a key bearish trend line with resistance at $4,000.
The cryptocurrency now trades above its 100-hourly Simple Moving Average, providing technical support for further advancement.

A bullish divergence has formed between price action and the RSI momentum indicator. Ethereum created a higher low compared to its August bottom while the RSI made a corresponding lower low.
Key Price Levels to Watch
The first major resistance sits at $4,200 where billions in short positions face forced covering. A clear break above this level could push prices toward $4,250 and potentially $4,320.
The 76.4% Fibonacci retracement level near $4,170 represents another important resistance zone to monitor.
On the downside, initial support lies at $4,050 with major support at $4,000. Failure to hold above $4,000 could lead to declines toward $3,920 and $3,880.
Smart money traders may specifically target the liquidation zone above $4,200 to capitalize on forced buying from short covering activities.
Current hourly RSI readings above 50 indicate improving momentum conditions. The MACD indicator shows some momentum loss but remains in bullish territory.
Ethereum’s recovery coincides with similar movements in Bitcoin and broader cryptocurrency markets.
Get 3 Free Stock Ebooks
Discover top-performing stocks in AI, Crypto, and Technology with expert analysis.
- Top 10 AI Stocks - Leading AI companies
- Top 10 Crypto Stocks - Blockchain leaders
- Top 10 Tech Stocks - Tech giants

