
 Price: Critical Support Zone Tested as Analysts Map Next Move")
Quick Overview
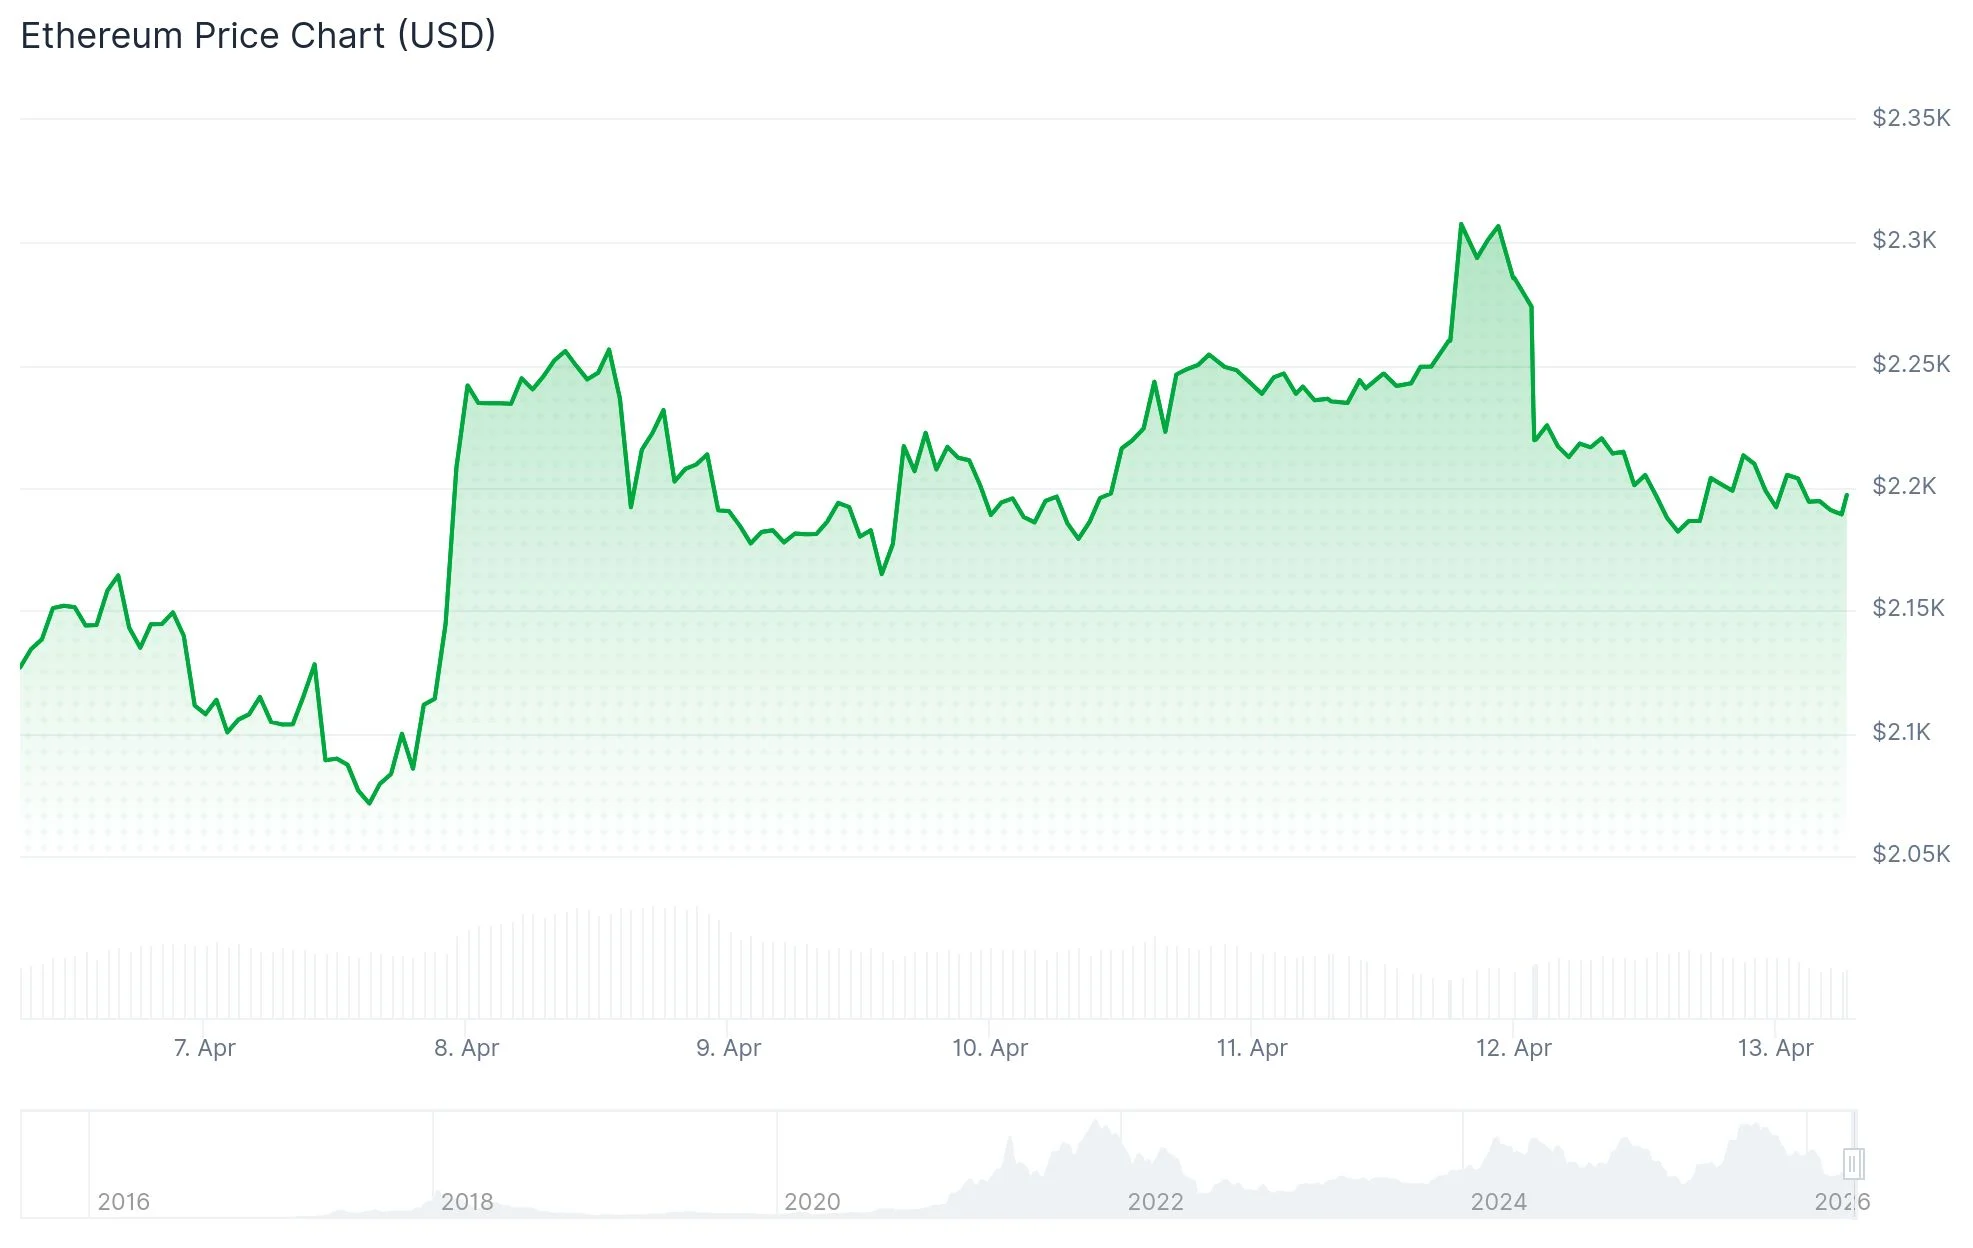
- Ethereum currently trades near $2,181, examining crucial support between $2,150 and $2,200.
- Breaking below $2,150 may send ETH toward the psychological $2,000 mark.
- Technical indicators show RSI at 53.53 with ETH positioned above short-term moving averages but beneath longer-term ones.
- Long-term chart analysis from Ali Charts identifies deeper support levels at $1,550 and $1,070 if present zones collapse.
- Maintaining current support could enable a rally toward $2,400, with $2,624 representing the subsequent resistance milestone.
Ethereum finds itself at a critical juncture that market participants are monitoring with heightened attention. Current data shows ETH changing hands at $2,181.19, reflecting a 2.89% decline across the previous 24-hour period. The asset registers $28.19 billion in trading volume alongside a $263.38 billion market capitalization.
Market observers are concentrating their attention on the $2,150–$2,200 range. Market analyst Ted highlighted via X that Ethereum momentarily approached a breakdown beneath $2,200, influenced by widespread risk-averse behavior throughout international markets. He emphasized this range as the probable zone where demand will either materialize or evaporate.
Should ETH successfully defend the $2,150 threshold, near-term projections suggest sideways movement followed by a potential advance toward $2,400. This price point represents the initial significant barrier. Beyond that resistance, technical charts identify approximately $2,624 as the following objective.
Conversely, a breakdown beneath $2,150 would likely direct attention toward $2,000 — a whole-number benchmark that has historically functioned as psychological support.
Technical Metrics Present Neutral-to-Bullish Signals
From a technical standpoint, the Relative Strength Index registers 53.53, marginally exceeding its average of 53.40. This measurement suggests modest bullish positioning without demonstrating overwhelming directional conviction.

Ethereum maintains its position above the 20-day SMA ($2,117.30) and 50-day SMA ($2,080.00), confirming that immediate support structures remain intact. Nevertheless, the asset continues trading beneath the 100-day SMA at $2,360.14 and the 200-day SMA at $2,918.05. This positioning reveals underlying weakness in the extended trend.
The MACD indicator shows the MACD line marginally exceeding the signal line, potentially signaling preliminary stabilization efforts. Analysts emphasize, however, that sustained accumulation activity is necessary before confirming a genuine reversal.
Extended Timeframe Analysis Highlights $1,550 and $1,070 Zones
Crypto analyst Ali Charts shared a weekly Ethereum chart via X demonstrating that Ethereum could still be operating within a parallel channel structure. Based on this technical framework, the two primary downside targets under observation are $1,550 and $1,070.
These price points aren’t arbitrary — both correspond with historical reaction zones visible on weekly timeframes. The $1,550 level would represent the initial major foundation should current support fail to hold. Beneath that threshold, $1,070 emerges as the more substantial support destination.
Daily chart examination additionally reveals that losing the $2,155 area would likely lead to approximately $2,015 as the immediate destination. Further deterioration would bring $1,775 into focus as an additional support region.
As of April 13, 2026, Ethereum is priced at $2,181.19, with the $2,150 level serving as the decisive threshold for immediate price development.
Get 3 Free Stock Ebooks
Discover top-performing stocks in AI, Crypto, and Technology with expert analysis.
- Top 10 AI Stocks - Leading AI companies
- Top 10 Crypto Stocks - Blockchain leaders
- Top 10 Tech Stocks - Tech giants

