
 Price Eyes Breakout After Reclaiming $2,100 Support Zone")
Quick Overview
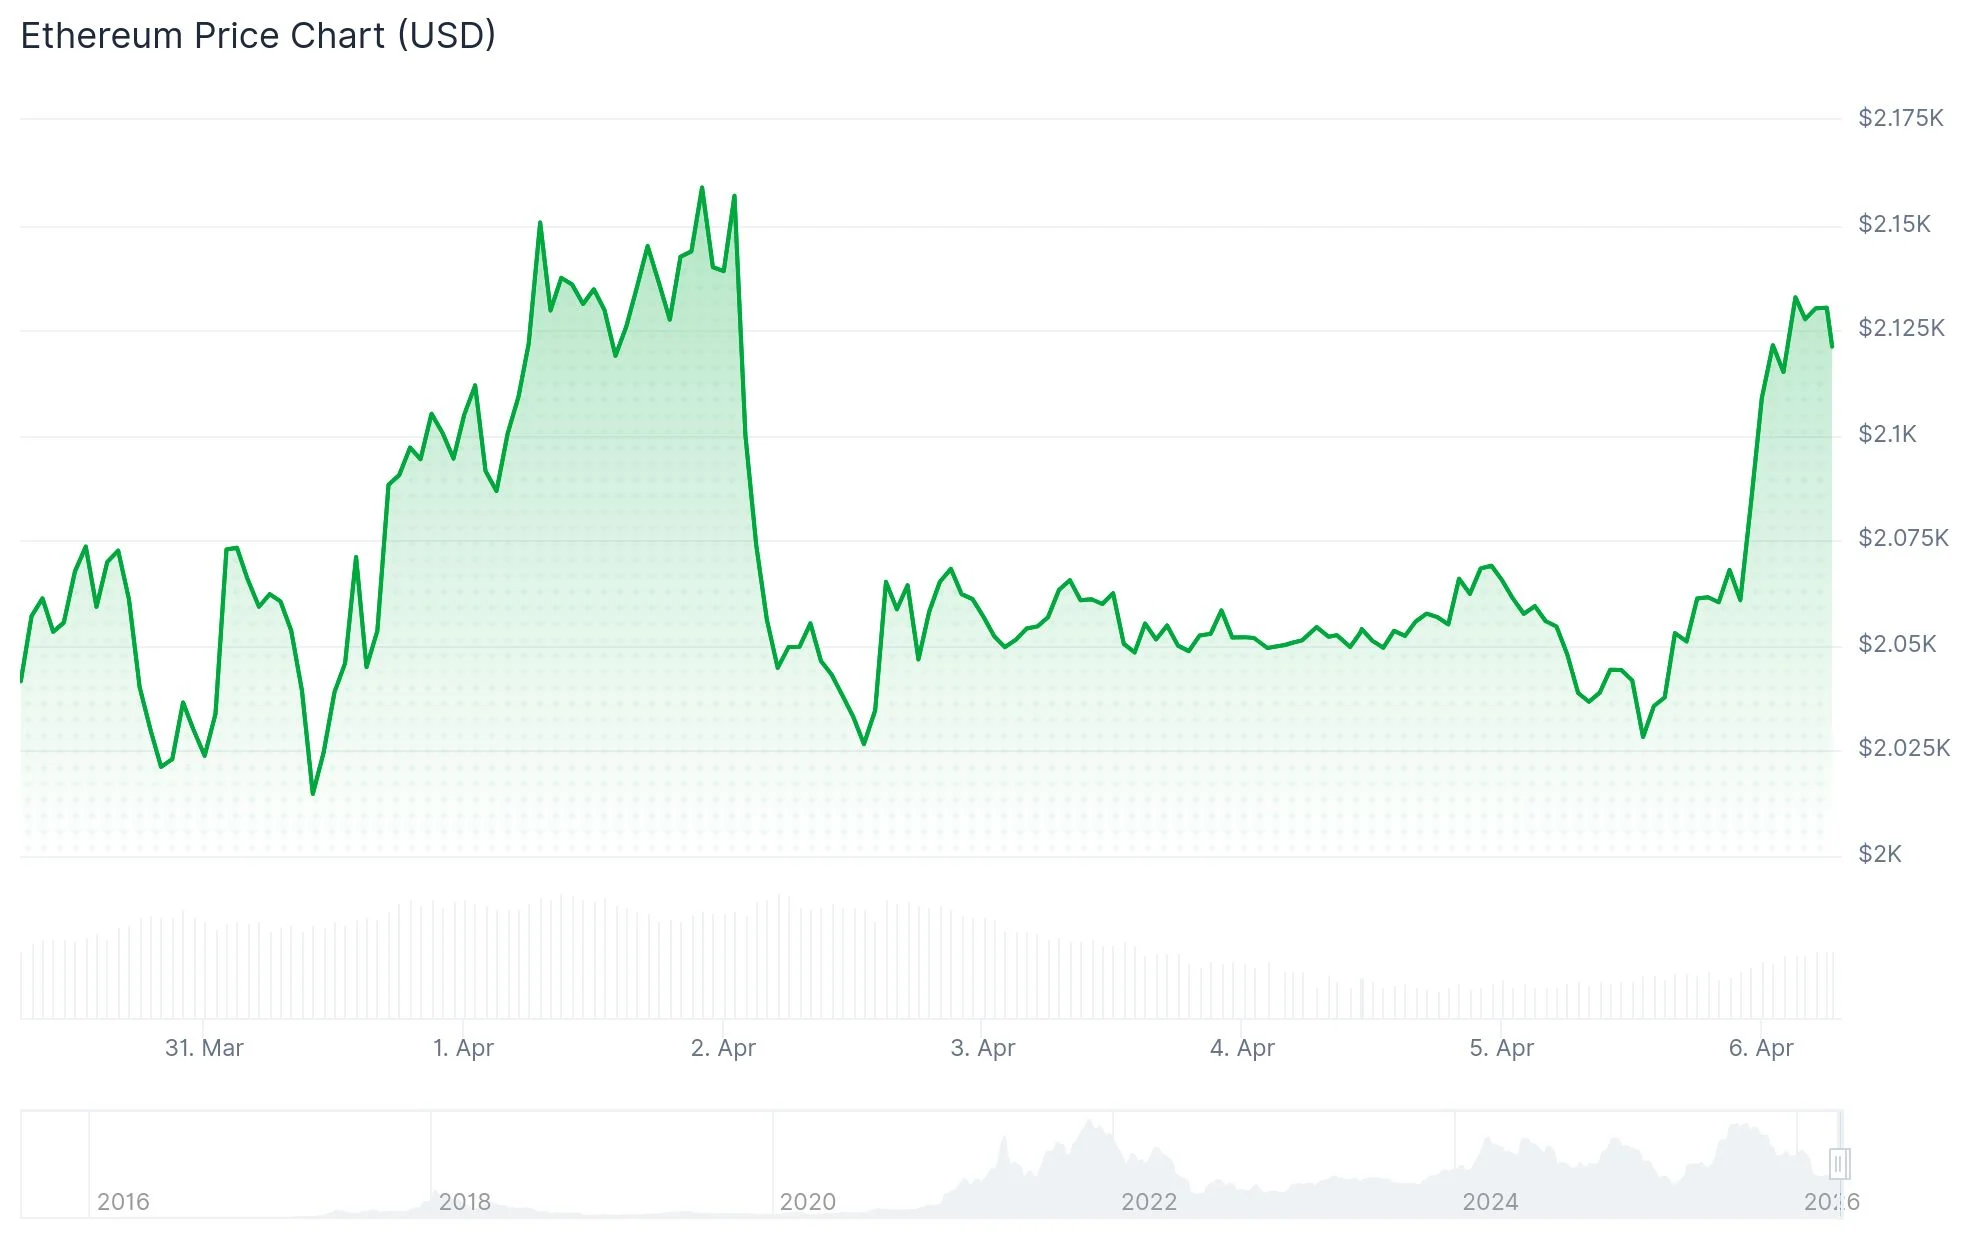
- Ethereum is currently trading above the $2,080 threshold with immediate resistance positioned at $2,150
- The $2,000 price point represents crucial support — a breakdown could spark significant long position liquidations
- Breaking through the $2,150–$2,180 zone may clear the way toward $2,220–$2,350 targets
- Longer timeframe analysis reveals an ascending channel pattern established since 2022
- Crypto analyst Ali Charts highlights $1,551 and $1,070 as important support zones if the channel structure fails
Ethereum has climbed back above the $2,080 mark following a bounce from lows around $2,017. The asset successfully breached a significant bearish trendline at $2,065 on the one-hour timeframe and is currently positioned above its 100-hour Simple Moving Average.
This recovery drove ETH beyond the 50% Fibonacci retracement calculated from the $2,168 peak down to the $2,017 bottom. The price now approaches the 83.2% Fib level around $2,140, which aligns with the initial major resistance area.
Traders should focus their attention on the $2,150 level at present. This zone has triggered multiple price reactions, establishing it as a clear near-term obstacle. For the recovery to maintain momentum, bulls must achieve a decisive breach above this threshold.
Should ETH successfully penetrate $2,150, the subsequent resistance emerges at $2,180. Pushing through that barrier could expose $2,220, with extended targets at $2,350 and $2,380 coming into play.
Potential Scenario if ETH Stalls at $2,150
If price action encounters rejection at $2,150, the first support level appears at $2,080, with $2,065 serving as the next line of defense. Slipping beneath $2,065 might send ETH back down toward $2,020, with additional downside targets at $1,980 and $1,965.

Market analyst Ted emphasized the critical nature of the $2,000 zone. A decisive move below this psychological level could unleash a substantial wave of liquidations, given that numerous leveraged long positions are likely concentrated around this price point. Such forced selling pressure could propel a rapid decline toward $1,755 or even $1,693.
The near-term trading range is therefore clearly established. ETH is either constructing a foundation for a breakout above $2,150 or faces the threat of a more aggressive selloff should $2,000 support collapse.
Broader Chart Structure Suggests Bullish Framework
Taking a wider perspective, technical analyst James Easton UK presented a chart illustrating Ethereum trading within an expansive ascending channel dating back to 2022. The lower trendline has successfully defended against multiple significant pullbacks, with demand consistently emerging near this support zone.
The upper channel boundary has also been challenged during stronger upward moves, forming a broad range where substantial corrections haven’t necessarily invalidated the overarching uptrend. This structural framework remains valid provided the rising support trendline continues to hold.
Crypto analyst Ali Charts shared on X that assuming ETH continues trading within this channel pattern, $1,551 and $1,070 represent the crucial support zones to track beneath current price levels.
As of April 6, 2026, Ethereum has gained 0.55% and is trading above the $2,080 level, with the $2,150 resistance zone serving as the immediate challenge for bullish continuation.
Get 3 Free Stock Ebooks
Discover top-performing stocks in AI, Crypto, and Technology with expert analysis.
- Top 10 AI Stocks - Leading AI companies
- Top 10 Crypto Stocks - Blockchain leaders
- Top 10 Tech Stocks - Tech giants

