
 Price: Massive Liquidation Wave Sparks Buy-the-Dip Calls")
TLDR
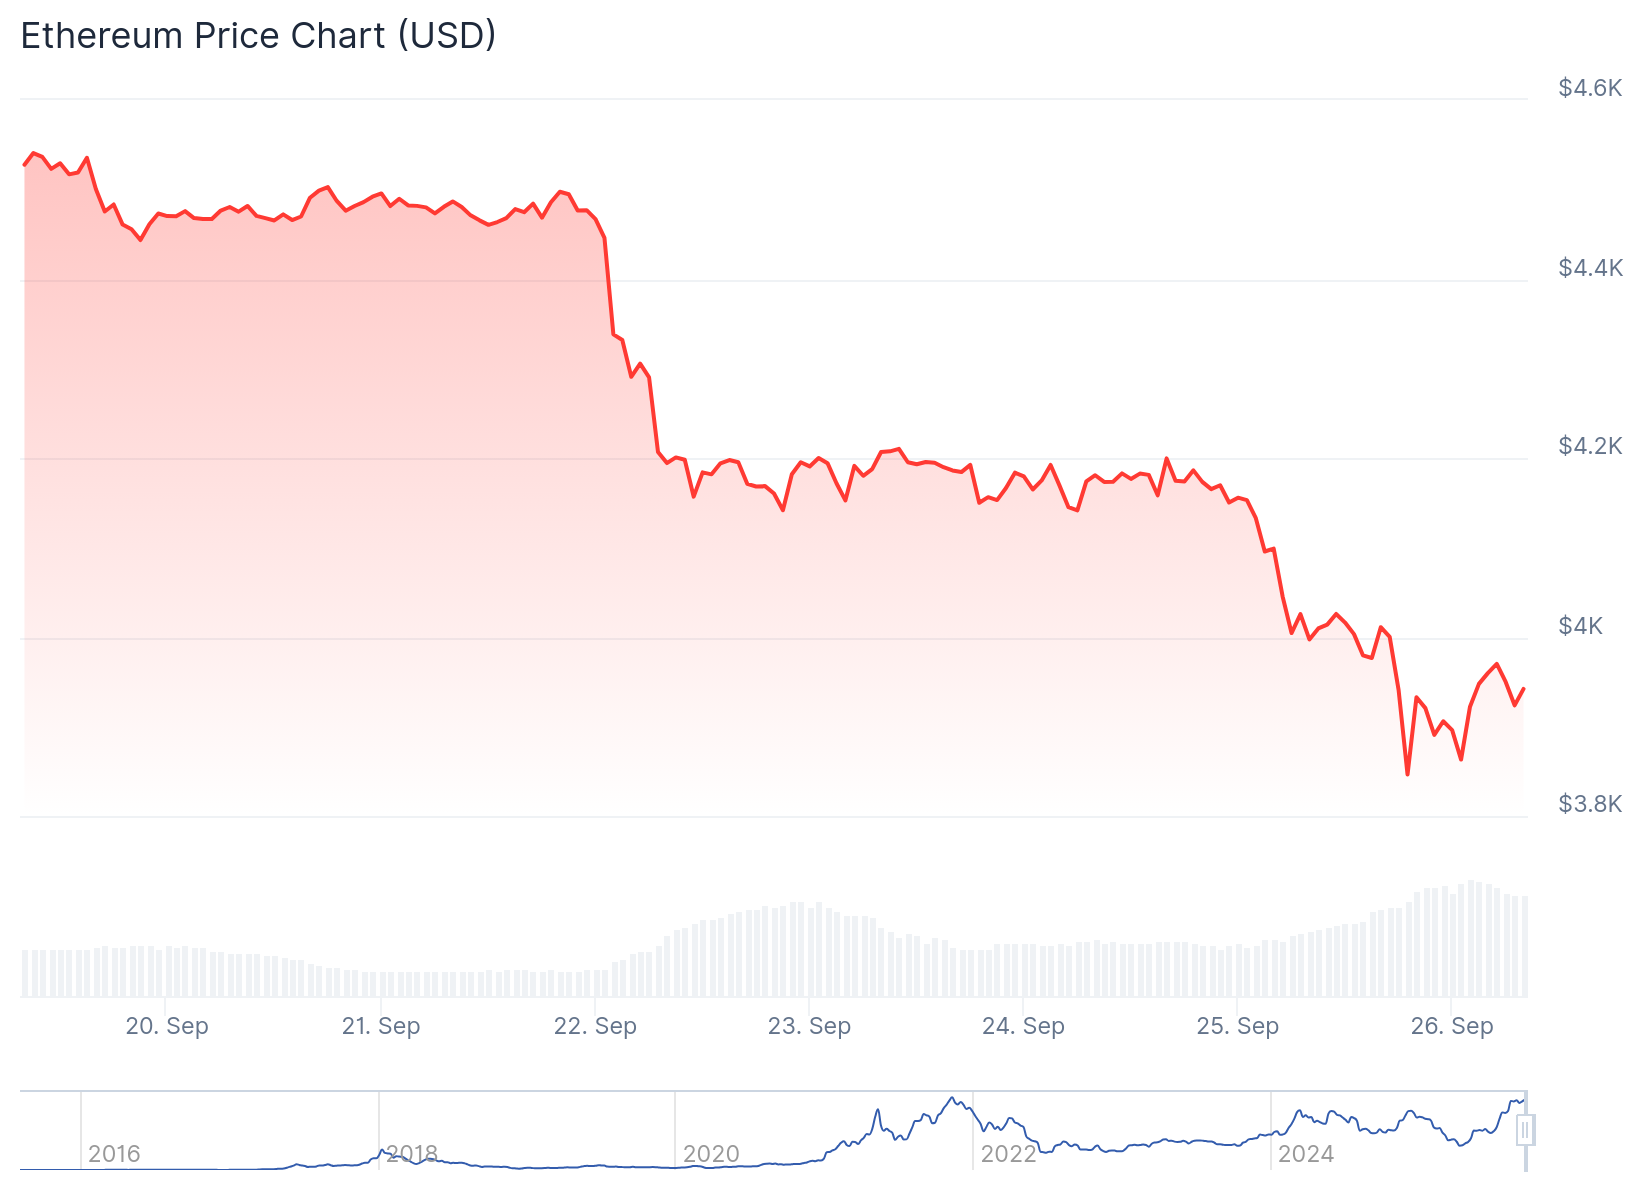
- Ethereum price dropped 13% from $4,400 highs, currently testing support around $3,650-$3,850
- Mid-sized holders with 10,000-100,000 ETH are driving accumulation while large whales reduce positions
- Crypto market liquidations hit $1.1 billion with Ethereum accounting for $409 million in 24 hours
- Spot Ether ETF outflows exceeded $250 million despite launch of first staking ETF
- Technical analysts identify potential buying opportunities as correction may be nearing bottom
The Ethereum market is experiencing a dramatic ownership shift as mid-sized investors take control of accumulation patterns. ETH price has declined 13% from recent peaks above $4,400, now trading near $3,865.
This correction has triggered massive liquidations across cryptocurrency markets. Total liquidations reached $1.06 billion in 24 hours, affecting 233,337 traders worldwide. Ethereum led these liquidations with $409 million, while Bitcoin accounted for $272 million.
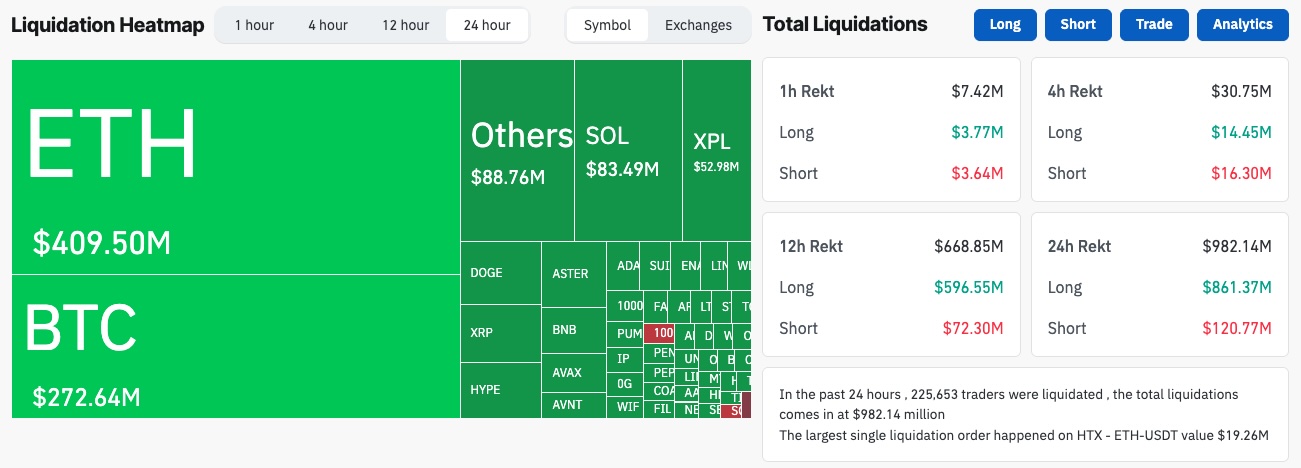
The largest single liquidation occurred on Hyperliquid, where traders closed an ETH-USD position worth $29.12 million. This selling pressure emerged ahead of a $23 billion crypto options expiry.
Joao Wedson from Alphractal identified a shift in Ethereum ownership dynamics. Large whales are reducing holdings while mid-sized sharks holding 10,000 to 100,000 ETH are increasing their market share.
These sharks now drive most accumulation activity. The pattern shows funds and private investment firms taking positions as larger institutional holders exit the market.
Wealth Distribution Patterns Change
The ownership shift appears in Ethereum’s wealth distribution metrics. The Gini coefficient, measuring inequality, is rising after months of decline.

This increase shows ETH ownership consolidating among wealthier addresses. The concentration happens primarily among mid-sized entities rather than the largest whale addresses.
Traditional whales representing exchanges, large funds, or former miners continue reducing positions. Their exit creates opportunities for sharks to dominate accumulation patterns.
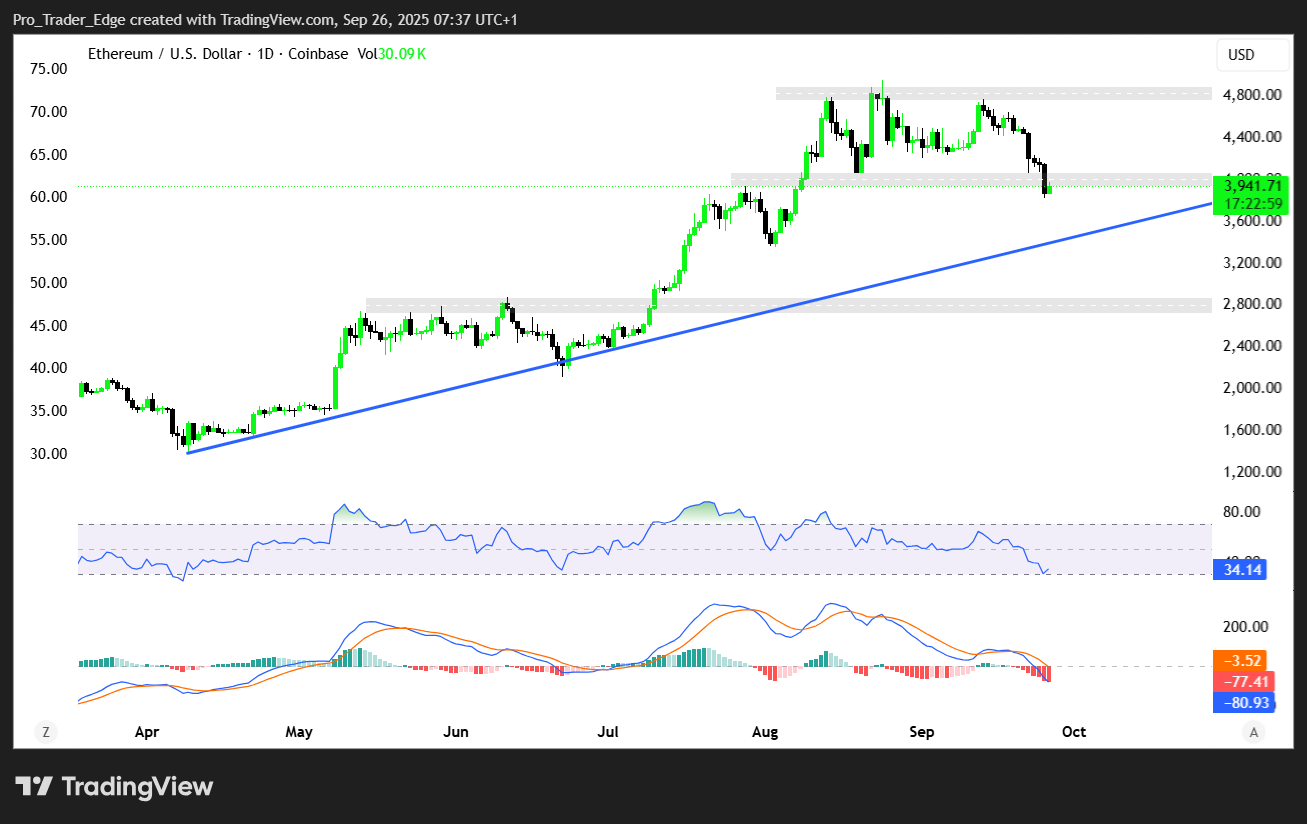
Ethereum remains above key technical levels despite recent corrections. The cryptocurrency holds above the 20 EMA at $3,653, the 50 EMA at $3,162, and the 200 EMA at $2,483.
Technical indicators show mixed signals for near-term direction. The MACD histogram stays positive but slows momentum, while the Chaikin Oscillator declines at 57K levels.
The RSI likely sits between 60-65, indicating overbought conditions before the pullback. These signals suggest consolidation before potential upward movement resumes.
Support and Resistance Levels
Crypto analyst Ted Pillows outlined critical price levels for traders. ETH holds support near $3,822, representing recent lows. Breaking below this level could push prices toward $3,700-$3,750.
Resistance lies between $3,960 and $4,000 according to technical analysis. Pillows noted that ETH is entering a potential “buy zone” at current levels.
Michael van de Poppe highlighted the gap between current prices and the 20-day exponential moving average. The weekly 20-EMA is closing in, suggesting the correction may be nearing its bottom.
Van de Poppe believes these conditions present buying opportunities for investors. The technical setup indicates potential reversal patterns forming.
Spot Ether ETFs recorded over $250 million in outflows recently. Fidelity’s FETH led outflows with $158 million, showing weakening institutional sentiment.
The first Ether staking ETF launch failed to reverse negative flow trends. This suggests institutions remain cautious about Ethereum exposure at current price levels.
Despite institutional outflows, analysts see opportunities emerging. The combination of technical oversold conditions and mid-sized investor accumulation creates potential upside scenarios.
Near-term resistance sits between $4,450 and $4,500 for Ethereum. Support at $3,650 remains critical for maintaining short-term price stability and preventing further declines.
Get 3 Free Stock Ebooks
Discover top-performing stocks in AI, Crypto, and Technology with expert analysis.
- Top 10 AI Stocks - Leading AI companies
- Top 10 Crypto Stocks - Blockchain leaders
- Top 10 Tech Stocks - Tech giants

