
 Price Plunges Under $2,000 Amid $392M ETF Exodus")
Key Highlights
- ETH breached the $2,000 threshold with a 5% decline in 24 hours and 6% weekly loss
- Institutional ETF products witnessed continuous outflows for seven days totaling $392 million
- ETH demand metrics reached their weakest point in 16 months
- Critical support levels identified at $1,911 and $1,750 by market analysts
- Coins held on exchanges decreased from 22 million ETH in 2023 to approximately 15 million ETH
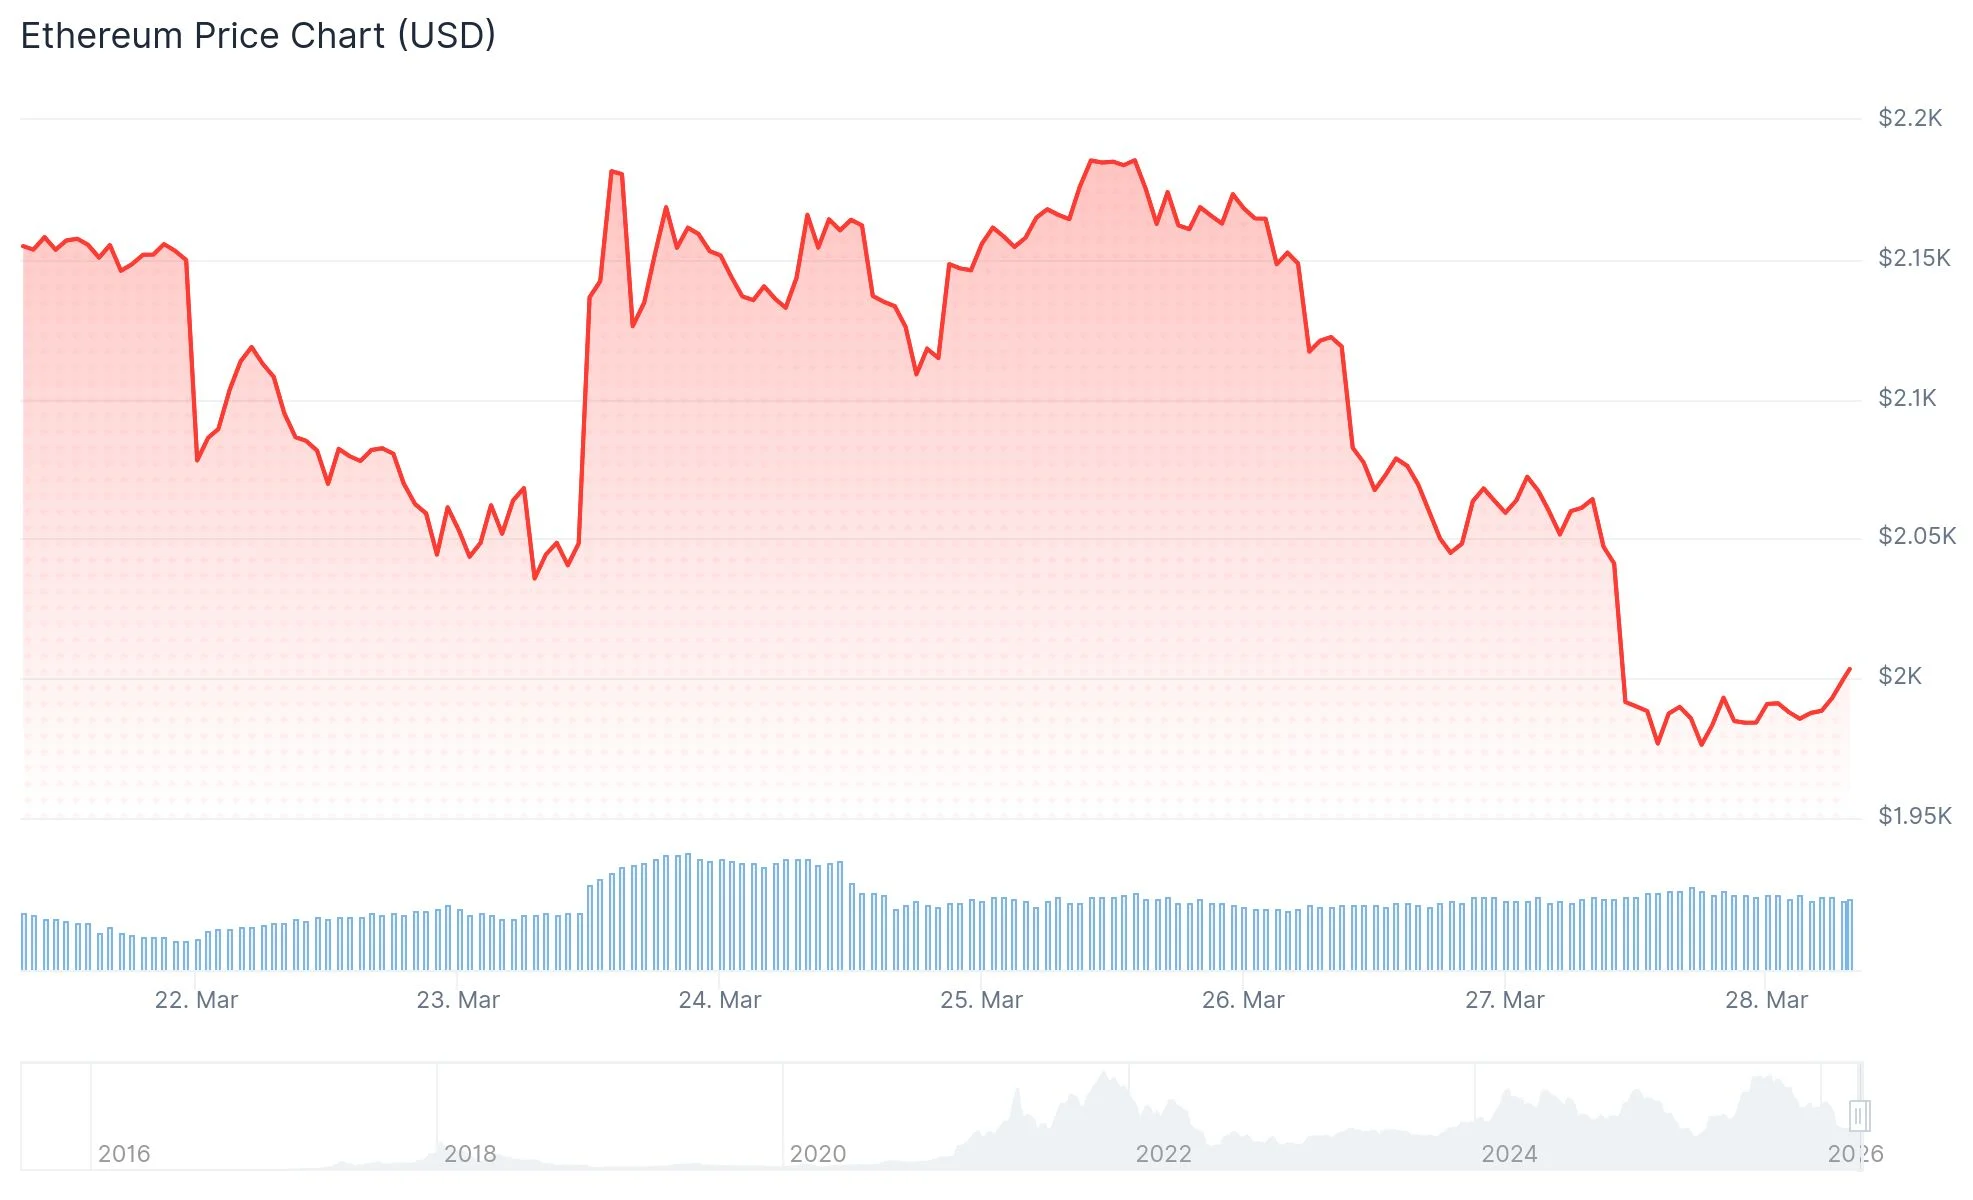
Ethereum breached the psychologically important $2,000 price level on Friday, March 27, 2026. The sudden decline resulted in more than $111 million worth of leveraged long positions being liquidated within a 24-hour window, based on figures from Coinglass.
The price action amplified ETH’s seven-day losses to 6%, turning the monthly performance negative.
Global tensions contributed to the selloff. Iran’s Islamic Revolutionary Guards Corps delivered threats to personnel at strategic facilities across Israel and Gulf nations, signaling an impending counter-offensive. These developments followed coordinated strikes by US and Israeli forces on Iranian infrastructure, heightening risk-off sentiment across financial markets.
Institutional appetite for Ethereum has evaporated rapidly. Spot Ethereum ETF products have experienced seven consecutive trading sessions of net redemptions, accumulating approximately $392 million in withdrawals. This institutional retreat, previously a cornerstone of bullish momentum, has completely stalled.
Market commentator Ted Pillows highlighted on X that daily ETH ETF redemptions hit $92.5 million, with BlackRock’s fund accounting for $43.2 million of Ethereum sales.

Retail trader enthusiasm has likewise diminished. The Coinbase Premium Index dropped deeper into negative territory, indicating US-based traders are either liquidating positions or remaining inactive.
Analytics from Capriole Investments reveal that observable demand for ETH has stayed negative throughout March, plummeting to its lowest reading in 16 months.
Charts Signal Continued Weakness
Analyzing the daily timeframe, ETH is trading beneath its 20-day exponential moving average. The 50-day and 100-day EMAs remain significantly overhead at $2,180 and $2,430 respectively, confirming the prevailing corrective momentum.
Technical analyst CryptoWZRD observed that when ETH closed below $2,200 earlier this week, it served as an initial signal preceding “further declines.” With both $2,100 and $2,000 now breached, attention shifts to the $1,750–$1,850 zone.
Trader CyrilXBT published analysis demonstrating ETH positioned considerably below its 200-day EMA located near $2,766. He cautioned that losing the $1,750 floor could drive ETH toward the $1,400–$1,500 range.
Exchange Balances Tell Different Story
One notable divergence appears in exchange reserve metrics. According to CryptoQuant information shared by analyst James Easton, Ethereum balances on trading platforms have declined from over 22 million in 2023 to approximately 15 million ETH currently. Easton characterized large holders as “stacking and staking.”
Nevertheless, declining exchange inventories don’t necessarily signal imminent price rebounds. While the metrics indicate token migration off platforms, they don’t definitively establish accumulation behavior.
On the institutional accumulation front, BitMine Immersion wallets acquired 117,111 ETH across a three-day period, according to Lookonchain tracking. The company had earlier verified a 65,341 ETH purchase.
ETH open interest climbed to 14.72 million ETH, despite funding rates flipping negative.
Near-term support is established at $1,911, with secondary support at $1,741. A decisive break beneath $1,741 would validate the continuation of the existing bearish trend.
Get 3 Free Stock Ebooks
Discover top-performing stocks in AI, Crypto, and Technology with expert analysis.
- Top 10 AI Stocks - Leading AI companies
- Top 10 Crypto Stocks - Blockchain leaders
- Top 10 Tech Stocks - Tech giants

