
 Price Prediction: $912 Million Exodus Creates Perfect Storm for Bears")
TLDR
- Ethereum price remains trapped below $4,500 resistance after seven consecutive days of ETF outflows totaling $912 million
- Technical analysis shows descending triangle pattern with potential 18% decline to $3,550 target
- Network revenue dropped 44% in August while futures open interest fell 18% from peak levels
- Spot buying pressure remains weak with negative volume delta indicating limited demand
- Regional outflow data shows broad-based institutional retreat led by $440 million US withdrawals
Ethereum price continues struggling below the critical $4,500 resistance level as massive institutional outflows create mounting pressure on the world’s second-largest cryptocurrency. The token has failed to sustain gains above this key threshold for more than two weeks.
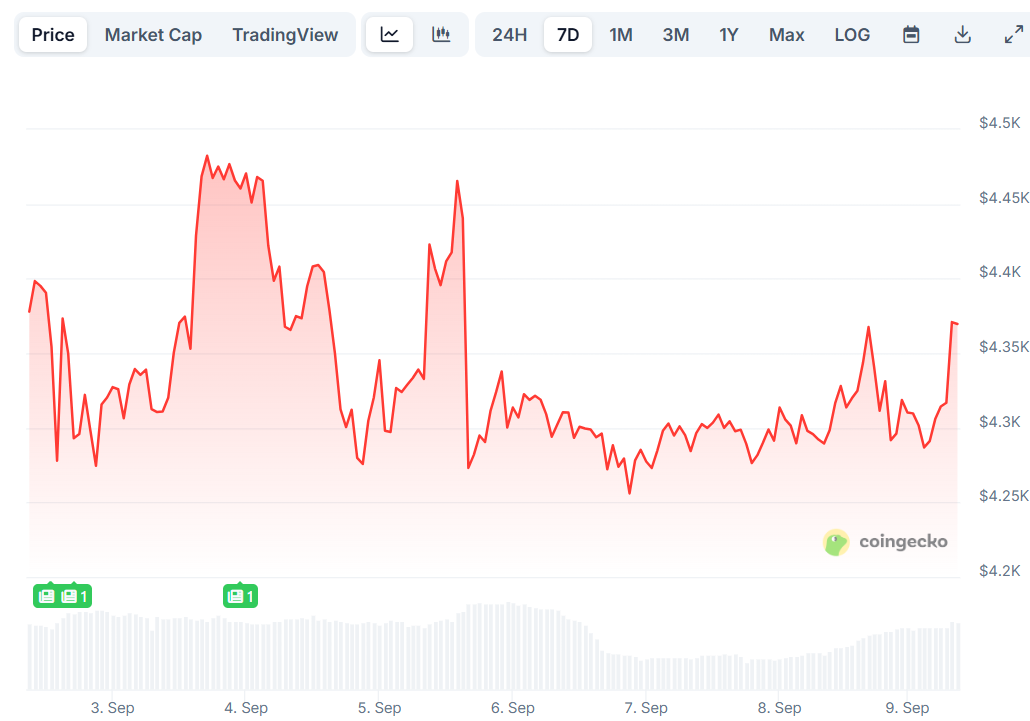
Current price action around $4,372 represents a retreat from August all-time highs near $4,950. The sustained selling pressure reflects broader market caution despite supportive economic conditions including expectations for September rate cuts.
Spot Ethereum ETF data reveals the extent of institutional withdrawal from ETH positions. These investment products posted outflows every single trading day last week, with Friday alone witnessing $446.8 million in redemptions.
Total weekly outflows reached $787.6 million according to SoSoValue data. The selling came from diverse ETP providers rather than concentrated sources, suggesting widespread institutional caution rather than isolated profit-taking.
Year-to-date inflows still maintain $11.2 billion for Ethereum ETFs. However, the recent exodus has completely erased August gains and raised questions about near-term institutional appetite for the cryptocurrency.
Weak Demand Signals Across Multiple Metrics
Market structure data paints a concerning picture for Ethereum bulls. The spot volume delta metric shows persistent negative net buying on exchanges even during consolidation periods, indicating absent buyer interest.


This lack of real demand creates challenges for any potential breakout attempts above $4,500. Without fresh institutional or retail buying, sustained rallies become increasingly difficult to maintain.
Futures markets echo similar cooling trends. Open interest dropped 18% to $58 billion from the August 23 peak of $70 billion. Declining open interest typically signals reduced leverage and overall market participation.
Network fundamentals present mixed signals about underlying Ethereum health. Revenue fell 44% in August to $14.1 million from July’s $25.6 million despite price reaching new highs.
The Dencun upgrade implemented in March 2024 continues impacting fee structures by reducing transaction costs for layer-2 networks. While beneficial for users, lower fees reduce revenue flowing to ETH holders through token burns.
This impacts Ethereum’s deflationary mechanism and may weaken long-term price support dynamics. Network fees also declined approximately 10% over the past 30 days to $43.3 million.
Ethereum Price Prediction
Technical analysis points toward further downside risk in the near term. Ethereum has formed a descending triangle pattern since mid-August characterized by flat support around $4,200 and declining resistance.

A decisive break below the $4,200 support level could trigger moves toward $3,550 based on the pattern’s measured target. This represents an 18% decline from current trading levels.
Some analysts identify potential bounce levels before deeper corrections. Trader Ted Pillows noted ETH appears strong above $4,200 but expects possible retests of the $3,800-$3,900 range before any reversal.
The $3,745 level represents another key support zone that traders are monitoring closely. Current market structure suggests multiple headwinds are limiting upside potential while technical patterns favor lower support tests.
Regional flow analysis shows the United States led global outflows with $440 million in withdrawals. Sweden and Switzerland also posted outflows of $13.5 million and $2.7 million respectively, indicating broad-based institutional retreat from Ethereum positions.
Get 3 Free Stock Ebooks
Discover top-performing stocks in AI, Crypto, and Technology with expert analysis.
- Top 10 AI Stocks - Leading AI companies
- Top 10 Crypto Stocks - Blockchain leaders
- Top 10 Tech Stocks - Tech giants

