
 Price Prediction: Fed Rate Cuts Fuel Buying Frenzy Despite 15% Bloodbath")
TLDR
- Ethereum crashed 15% in 24 hours, causing $1.5 billion in liquidations – the highest in six months
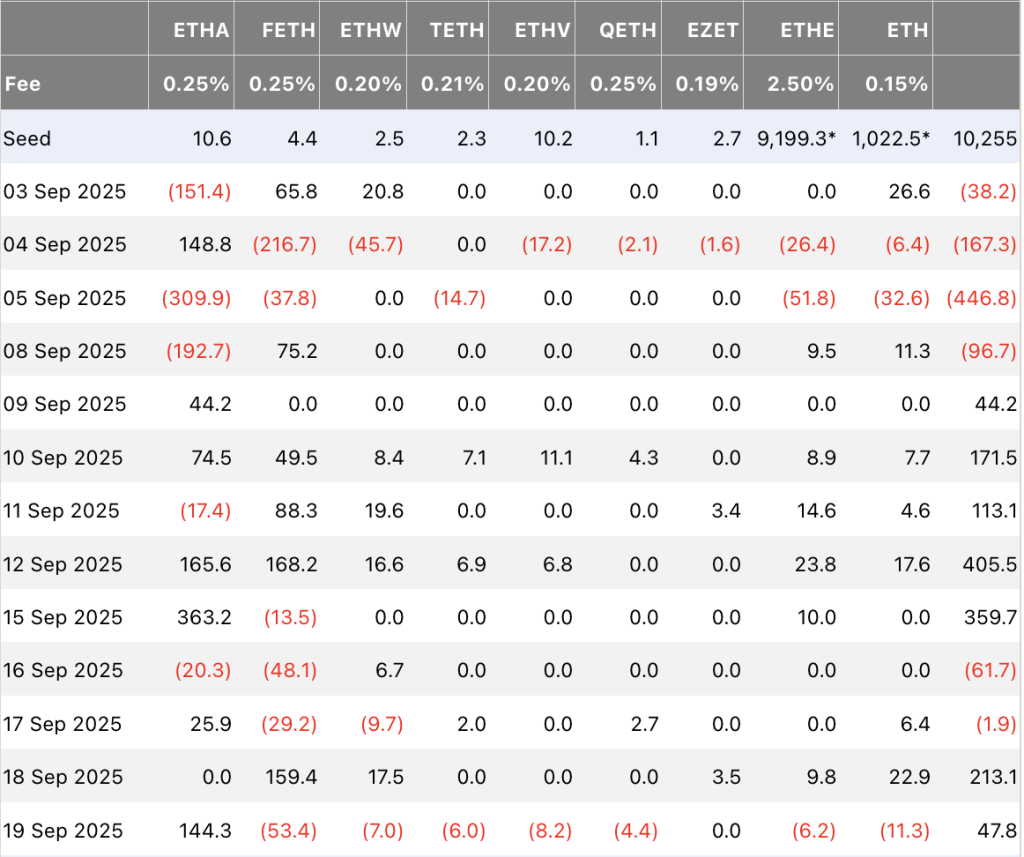
- BlackRock’s ETH ETF attracted $512 million in fresh capital despite the price decline
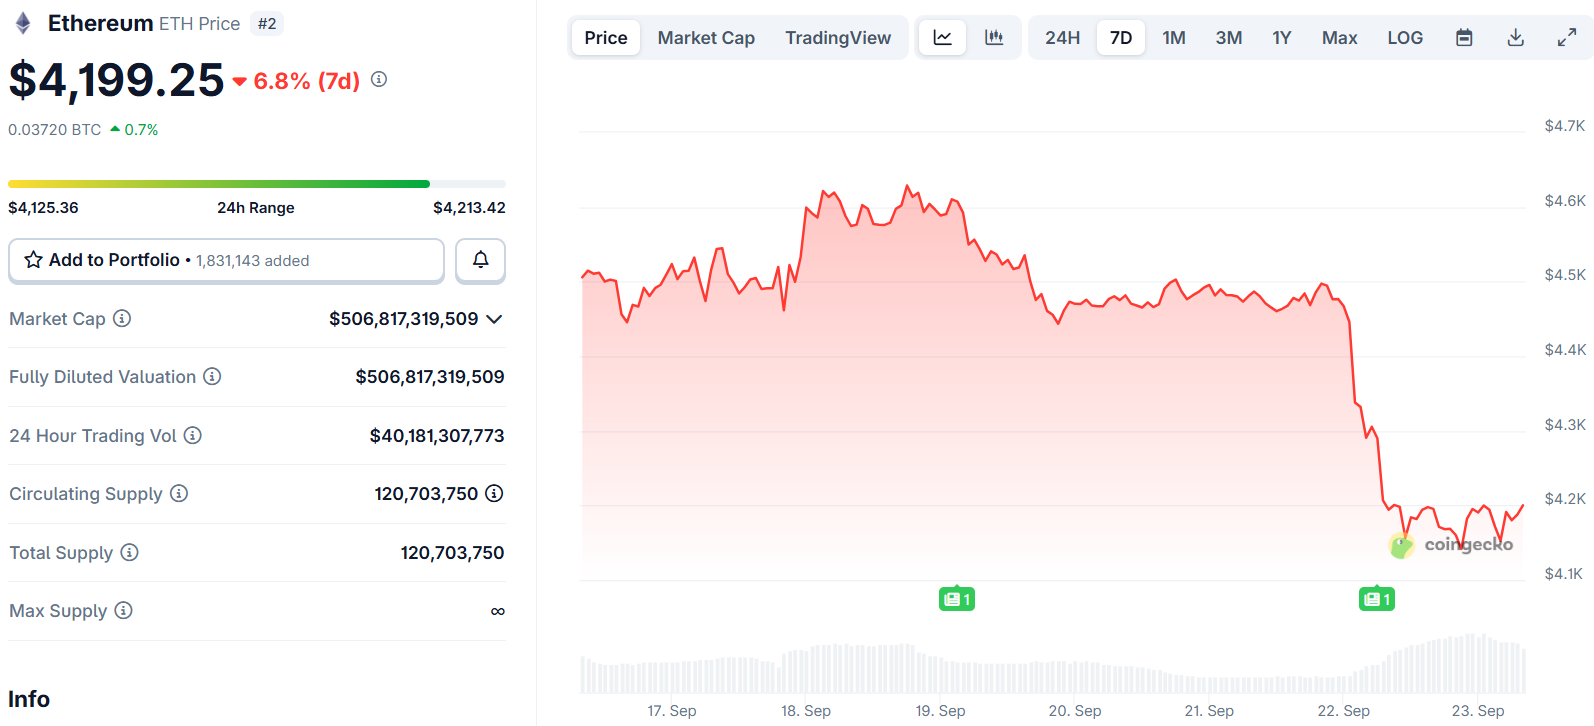
- ETH now trades near crucial $4,000 support after falling from $4,636 high
- Fed rate cuts of 25 basis points boost risk asset appetite with more cuts expected
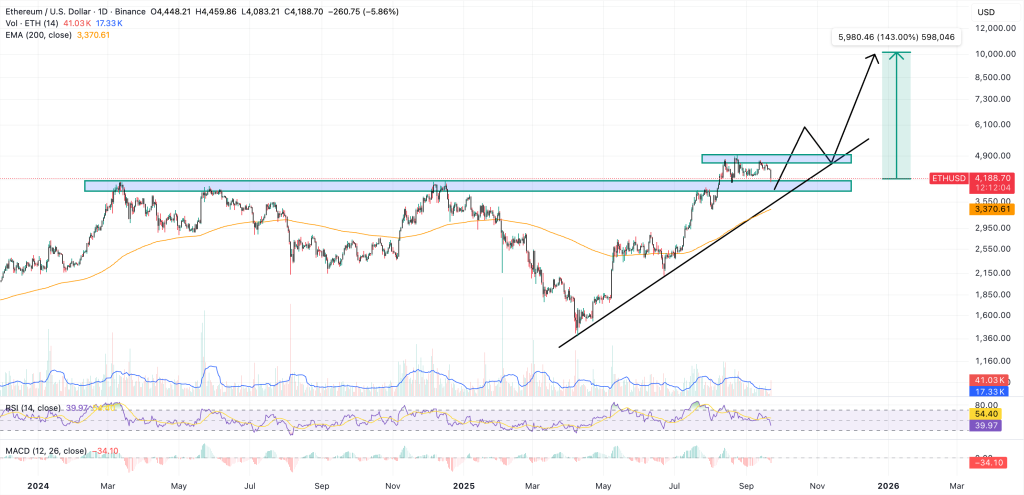
- Technical charts show bearish trend line at $4,360 resistance level
Ethereum has suffered a major price correction over recent days, with the world’s second-largest cryptocurrency plunging 15% in just 24 hours. This sharp decline pushed ETH down to test the psychologically important $4,000 support zone.
The dramatic selloff created chaos in the derivatives market. Over $1.5 billion worth of leveraged long positions were liquidated during the crash. This represents the largest liquidation event for Ethereum in six months.
The price action began when Ethereum failed to maintain momentum above $4,550. Bears quickly took control, driving the price through multiple support levels including $4,450 and $4,350.
The selling pressure intensified as ETH broke below the $4,120 support zone. Price action reached a temporary low at exactly $4,000 before showing signs of stabilization.
Institutional Interest Remains Strong
Despite the harsh price correction, institutional demand for Ethereum exposure continues growing. BlackRock’s spot Ethereum ETF recorded $512 million in net inflows during the past week.
This institutional buying occurred while Ethereum posted a 7.6% decline over the same period. The contrast suggests sophisticated investors view current price levels as attractive entry points.

The Federal Reserve’s recent 25 basis point interest rate cut has created a more favorable environment for risk assets. Market participants expect another rate reduction of similar magnitude next month.
Lower borrowing costs typically drive investment flows toward higher-risk assets like cryptocurrencies. The total market capitalization of alternative cryptocurrencies has grown beyond $1.7 trillion recently.
Technical Analysis Shows Mixed Outlook
Current price action shows Ethereum trading below both $4,300 and the 100-hourly simple moving average. The cryptocurrency managed a minor bounce above the 23.6% Fibonacci retracement level.
This retracement measures the decline from the recent $4,636 swing high down to the $4,000 support low. Initial resistance now appears near the $4,220 price level.
The next meaningful resistance zone sits around $4,250. Above that level, the 50% Fibonacci retracement near $4,320 represents the first major hurdle for any recovery attempt.
Chart patterns reveal a bearish trend line forming with resistance positioned at $4,360. Breaking above this technical level could open the path toward $4,450 or potentially $4,550.
However, failure to reclaim $4,220 resistance might trigger another leg lower. Initial downside support remains at $4,120, with stronger support near $4,050.
A decisive break below $4,050 would likely send Ethereum back toward the $4,000 level. Further weakness could target the $3,880 region, with the next major support zone located at $3,750.
Technical momentum indicators present a mixed picture. The hourly MACD is building momentum within bearish territory while the RSI has dropped below the neutral 50 level.
Ethereum Price Prediction
Ethereum currently sits at a critical juncture near two-month lows around $4,000. The cryptocurrency’s ability to hold this support level will likely determine near-term direction.
Strong institutional inflows through ETF products suggest underlying demand remains intact despite recent price weakness. The combination of lower interest rates and continued institutional adoption could provide fundamental support for higher prices over time.
Get 3 Free Stock Ebooks
Discover top-performing stocks in AI, Crypto, and Technology with expert analysis.
- Top 10 AI Stocks - Leading AI companies
- Top 10 Crypto Stocks - Blockchain leaders
- Top 10 Tech Stocks - Tech giants

