
 Price Prediction: Massive Bear Trap in September Could Launch ETH to $10,000")
TLDR
- ETH may drop to $3,350 in September before October recovery creates massive “bear trap”
- Current price action mirrors 2021 pattern that drove ETH from $200 to $4,000
- ETFs absorbed 286,000 ETH in one week showing institutional appetite
- Inverse head-and-shoulders pattern supports $10,000 price target
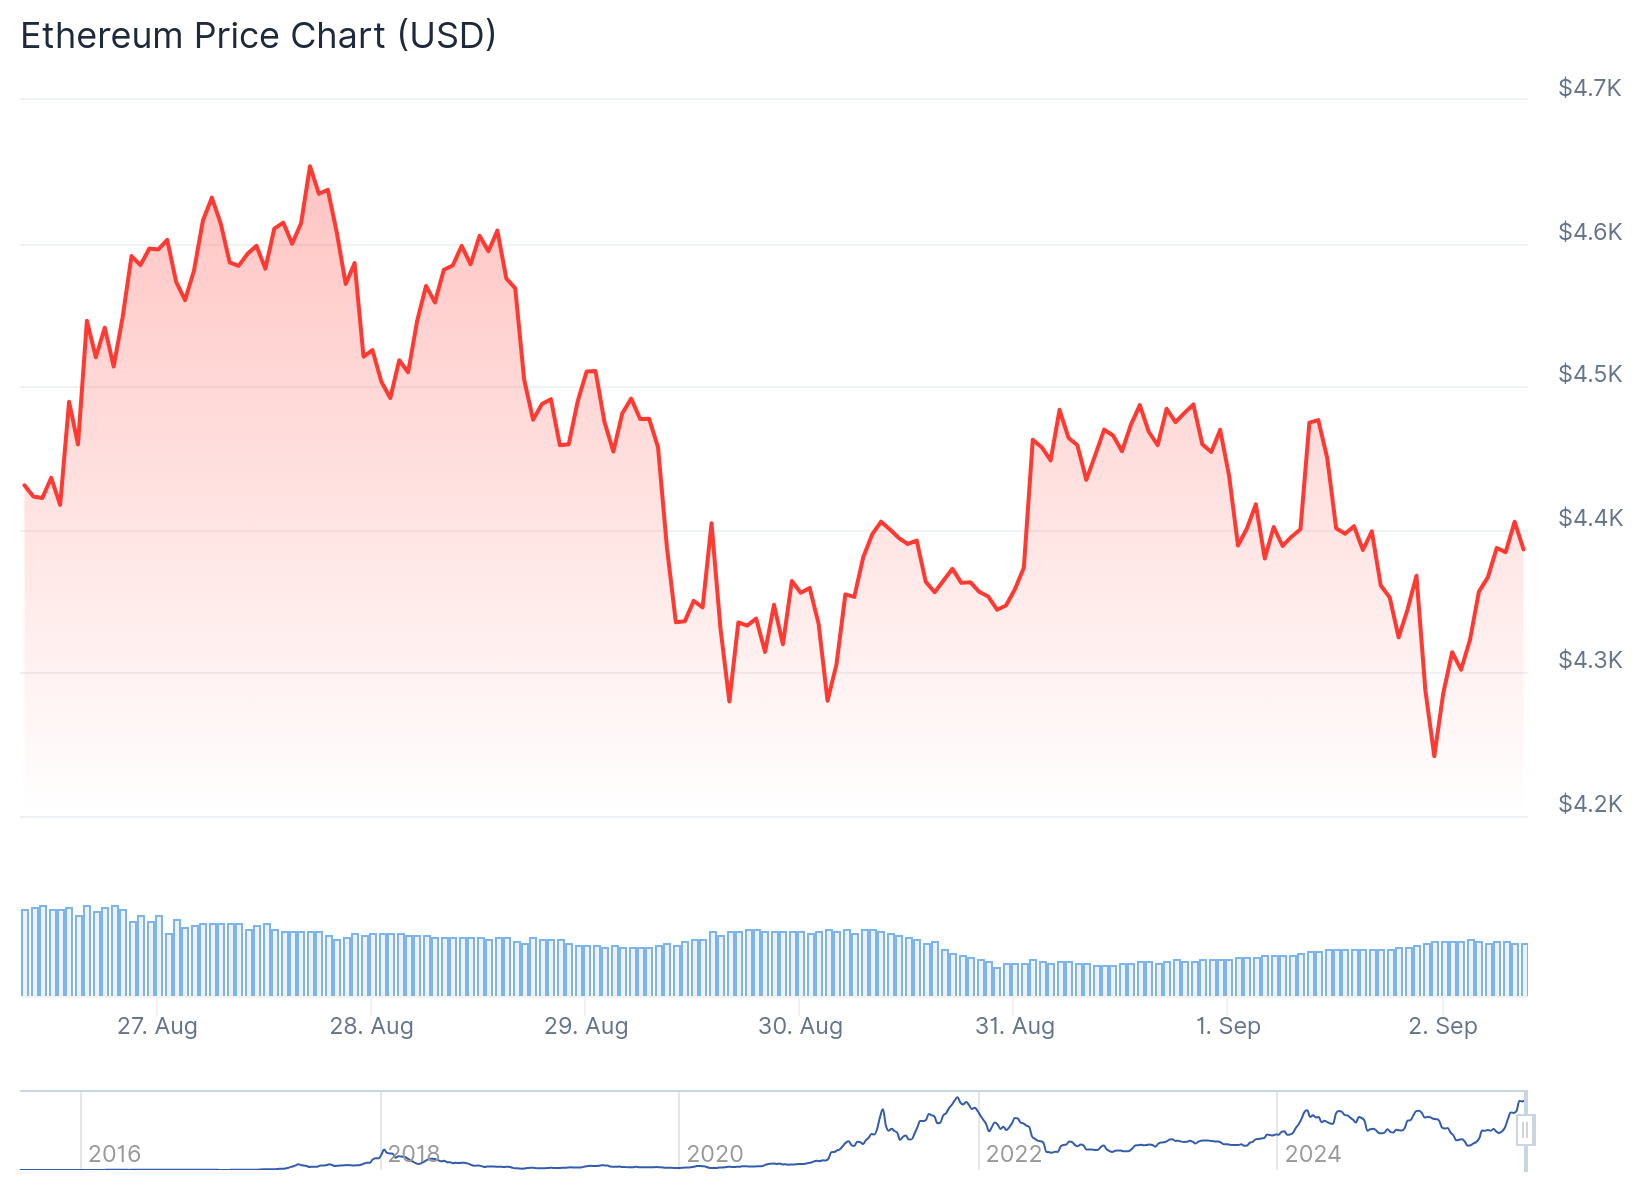
- ETH trades at $4,374, down 11.7% from all-time highs
Ethereum stands at a critical juncture as technical indicators and institutional demand create competing forces that could determine its next major price move. The second-largest cryptocurrency faces potential September weakness before what analysts believe could be a powerful October rally.
Trader Johnny Woo predicts ETH could experience the “biggest bear trap” this month. His analysis suggests Ethereum might fall to support around $3,350 in September before surging in October. This pattern mirrors September 2021 when ETH dropped 30% from $3,950 to $2,750 before hitting new all-time highs in November.
The potential head-and-shoulders formation could spook traders before invalidating during “Uptober.” Such price action would trap bearish investors who sold expecting further declines.
Technical Analysis Points to Bullish Setup
Analyst Merlijn The Trader identifies striking similarities between current price structure and Ethereum’s 2021 breakout. The pattern includes a dead-cat bounce, consolidation period, and final retest near $2,000. This identical setup previously powered ETH’s massive 1,900% gain.
Weekly charts show an inverse head-and-shoulders pattern forming. The left shoulder sits at $2,200, the head touched $1,500, and the right shoulder formed above $3,500. Resistance at $4,943 remains the key barrier for further upside.
Stoch RSI indicators show overbought conditions cooling, potentially allowing a retest of $4,100 support. This consolidation could provide the foundation for stronger buying pressure to resume.

Institutional Demand Surges
US spot Ethereum ETFs recorded inflows exceeding 286,000 ETH in one week, among the largest totals since launch. This institutional interest marks a shift from retail-driven previous cycles to professional money management involvement.
Glassnode data confirms steady institutional accumulation continues despite price volatility. Unlike 2021’s retail-led rally, institutions now provide structural support through consistent buying pressure.
ETF demand creates lasting supply changes. As institutions accumulate through these vehicles, exchange inventory decreases, making future selloffs harder to sustain.
Apollo Capital’s Henrik Andersson emphasizes fundamentals over technical patterns. He notes macro events like jobs data and Fed decisions will drive short-term moves, but structural factors matter more long-term.
Ethereum Price Prediction
Multiple technical factors align for potential bullish breakout. The 2021 pattern repetition, institutional ETF flows, and inverse head-and-shoulders formation all support higher prices ahead.
September weakness to $3,350 could create optimal entry points before October strength emerges. The $10,000 price target gains credibility as institutional demand continues absorbing supply.
ETH currently trades at $4,374 after touching $4,238 intraday lows. The 11.7% correction from all-time highs remains shallow compared to previous September declines, suggesting underlying strength persists despite near-term headwinds.
Get 3 Free Stock Ebooks
Discover top-performing stocks in AI, Crypto, and Technology with expert analysis.
- Top 10 AI Stocks - Leading AI companies
- Top 10 Crypto Stocks - Blockchain leaders
- Top 10 Tech Stocks - Tech giants

