
 Price Rallies as Bulls Reclaim Market Dominance Above $2,000")
Key Highlights
- ETH maintained support above $2,000 while derivatives metrics indicated heightened buying activity.
- Positive net taker volume has persisted since early March, reflecting increased buyer dominance.
- Futures open interest reached 6.4 million ETH, approaching 2024’s highest levels.
- Spot Ethereum ETFs recorded $120 million in net inflows, marking the strongest single-day performance since mid-March.
- Market observers emphasized the importance of maintaining $2,000, with deeper support identified between $1,750 and $1,800.
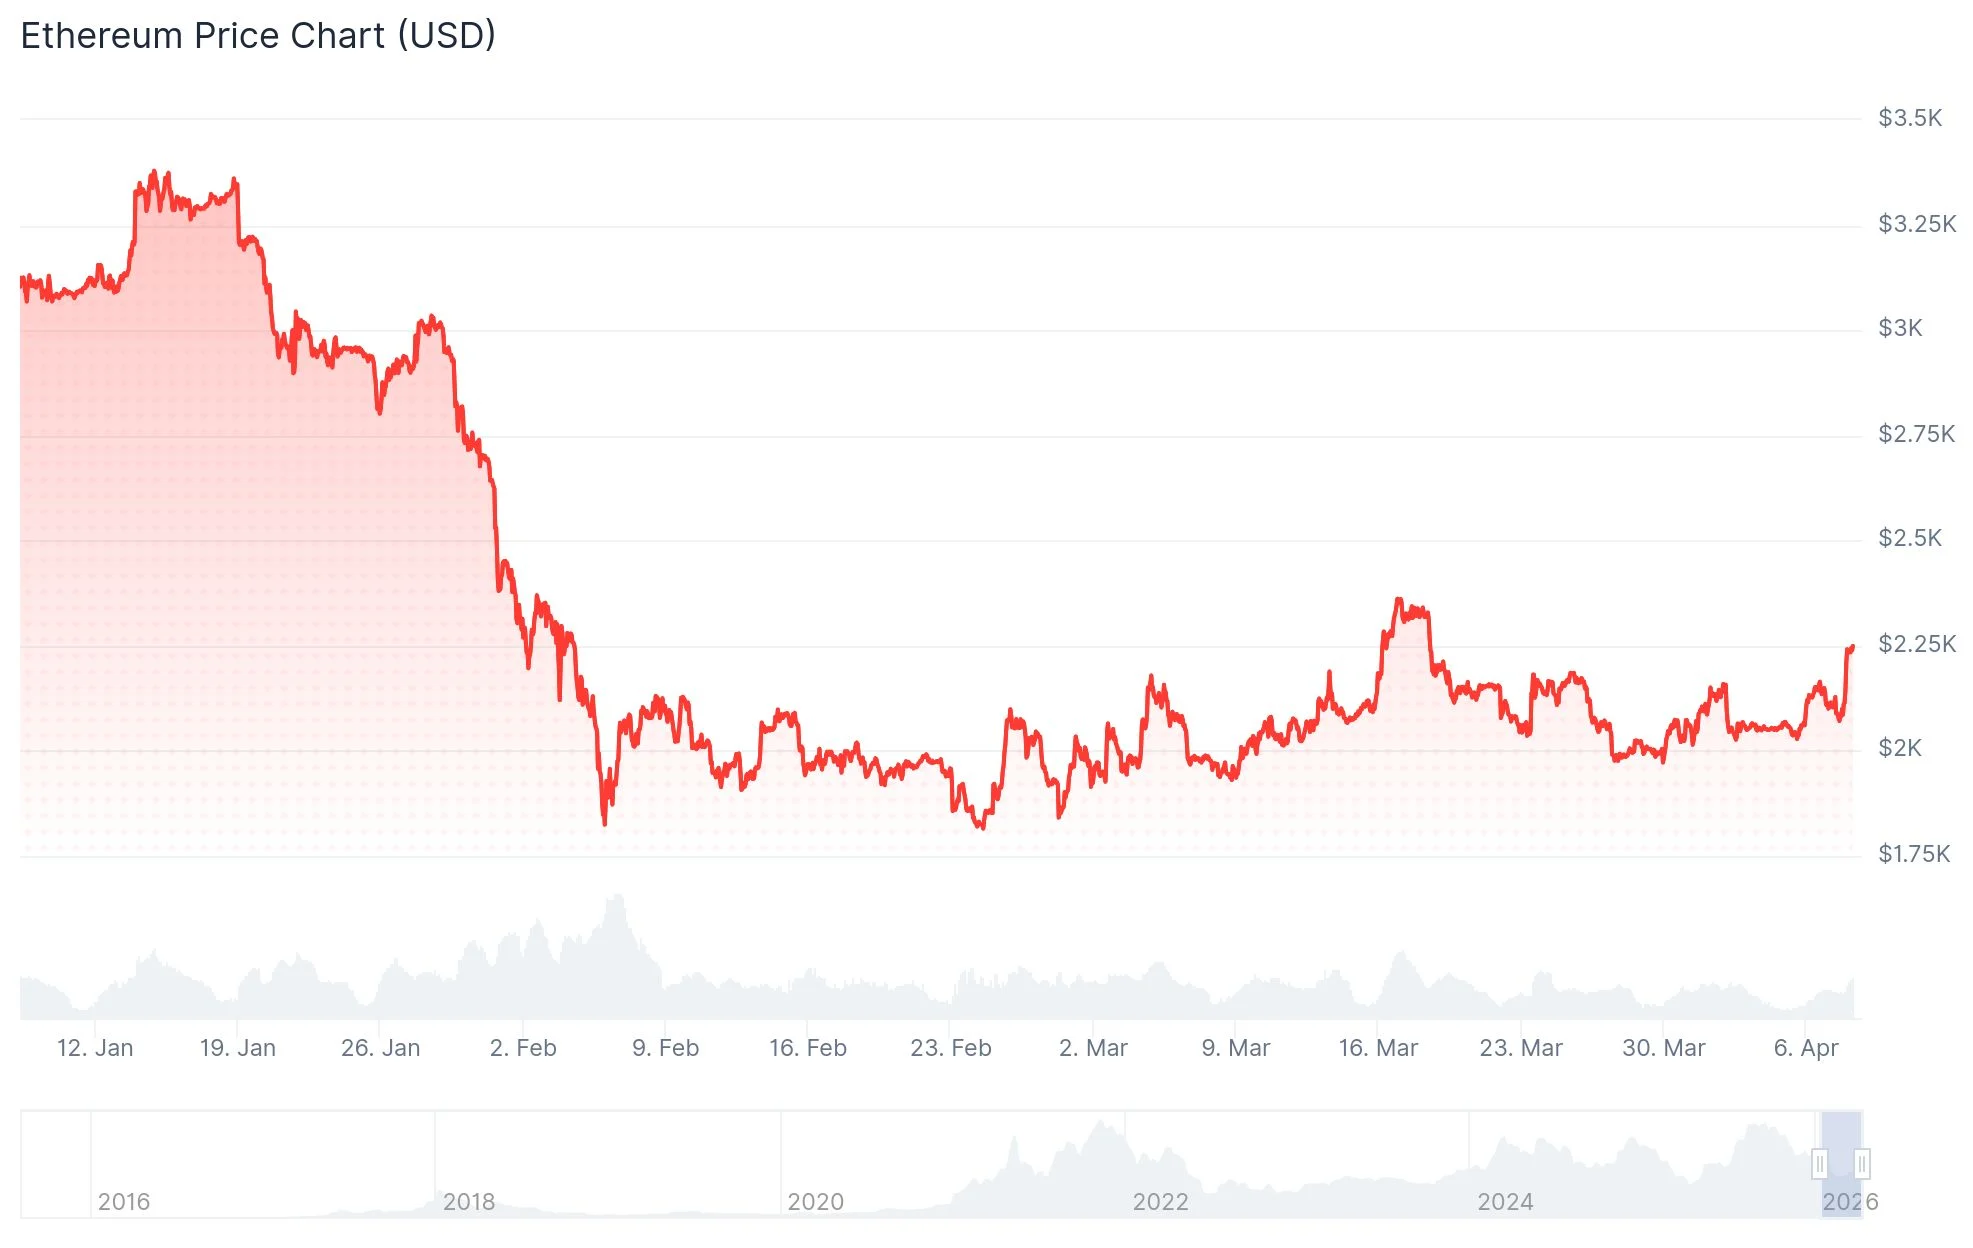
Ethereum (ETH) was trading near $2,249 following a bullish move that saw buyers successfully protect the critical $2,000 threshold. Emerging market indicators point toward strengthening demand conditions.
Market experts analyzing derivatives movements noted that purchasing activity has taken the lead. This transition has sparked discussions about a potential trend reversal.
Since March 6, net taker volume has consistently remained in positive territory. This indicator measures whether aggressive purchasing or selling dominates derivatives markets.
Darkfost, a market analyst, highlighted that buying momentum continues with net taker volume reaching $104 million. He noted this represents the first sustained shift of this magnitude in Ethereum derivatives since the previous bear cycle.
Strengthening derivatives metrics and ETF capital flows
The analyst suggested this configuration could sustain upward momentum if the pattern persists alongside growing spot market demand. Increasing futures engagement supports this assessment.

Open interest in Ethereum futures expanded to 6.4 million ETH. This figure approaches the record high of 7.8 million ETH established in July 2025.
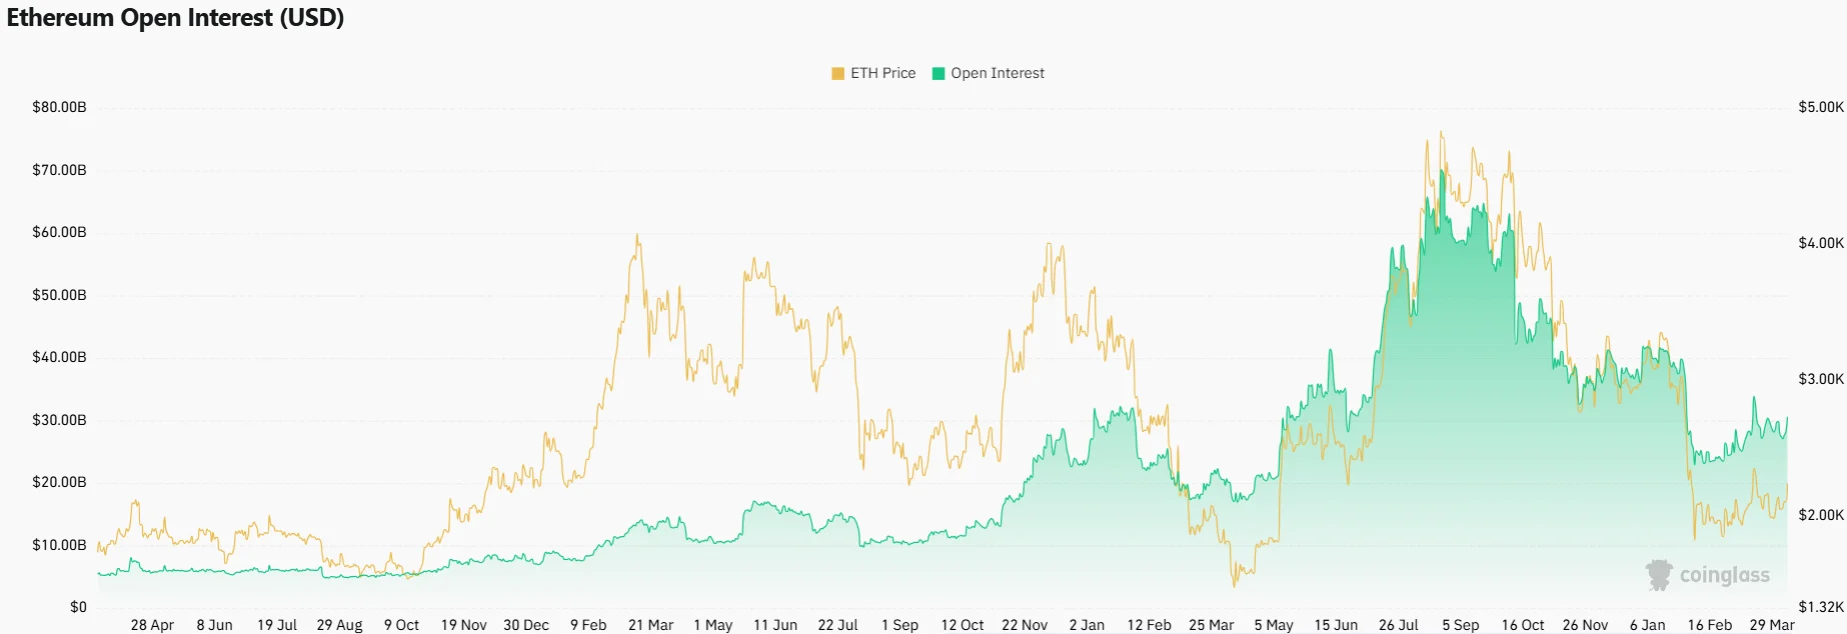
After declining to 5 million ETH in October, open interest has staged a notable recovery. This resurgence demonstrates continued engagement in derivatives trading.
Spot Ethereum ETFs similarly reflected shifting demand dynamics. These investment vehicles attracted $120 million in net inflows Monday, representing the strongest single-day performance since mid-March.
This influx arrived after a brief withdrawal period. The renewed capital flow indicates renewed buying interest from institutional investors based in the United States.
Ethereum achieved a near-term price advance beyond $2,250 before encountering resistance. Hourly chart analysis shows price action breaking above triangle resistance near $2,150 before consolidating.
Critical importance of $2,000 support zone
Market analysts emphasized that Ethereum’s technical outlook remains favorable provided the $1,800-$2,000 support range holds firm. This zone aligns with the 20-day exponential moving average and the lower boundary of a symmetrical triangle pattern.
Ted Pillows suggested Ethereum could initiate another upward leg if $2,000 support proves resilient. He cautioned that failure at this level might trigger a decline toward new yearly lows.
On-chain cost basis analysis reinforces $2,000 as a significant support area. Approximately 3.5 million ETH were accumulated around this price point.
Further downside support exists between $1,750 and $1,800, where 1.36 million ETH changed hands. A breakdown below this range could trigger the triangle’s measured move target near $1,460.
Ali Charts noted in a recent post that Ethereum’s 0.80 MVRV band is positioned around $1,880. Historical patterns suggest this level frequently marks periods of seller exhaustion where long-term holders typically accumulate.
For the immediate term, critical support levels include $2,220, $2,165, and $2,120. Overhead resistance is identified near $2,250 and $2,275, with current price action consolidating above the $2,200 threshold.
Get 3 Free Stock Ebooks
Discover top-performing stocks in AI, Crypto, and Technology with expert analysis.
- Top 10 AI Stocks - Leading AI companies
- Top 10 Crypto Stocks - Blockchain leaders
- Top 10 Tech Stocks - Tech giants

