
 Price: Record Leverage and Short Squeeze Potential Draw Trader Focus")
TLDR
- Ethereum is currently hovering around $2,050, maintaining the critical $2,000 psychological barrier
- The leverage ratio reached an unprecedented 0.78, indicating traders are deploying more borrowed funds than at any previous point
- Approximately $273 million worth of short positions face liquidation just above the current trading range near $2,030
- Weekly RSI stands at 33, hovering just above the 30 oversold threshold
- Critical price levels: $2,120 represents upside resistance, while $1,930 marks downside support
Ethereum has found itself trapped within a narrow trading corridor for several weeks, with the fight for the $2,000 level now capturing significant trader interest. Given the unprecedented leverage levels and a substantial concentration of short positions positioned overhead, any breakout could trigger substantial volatility.
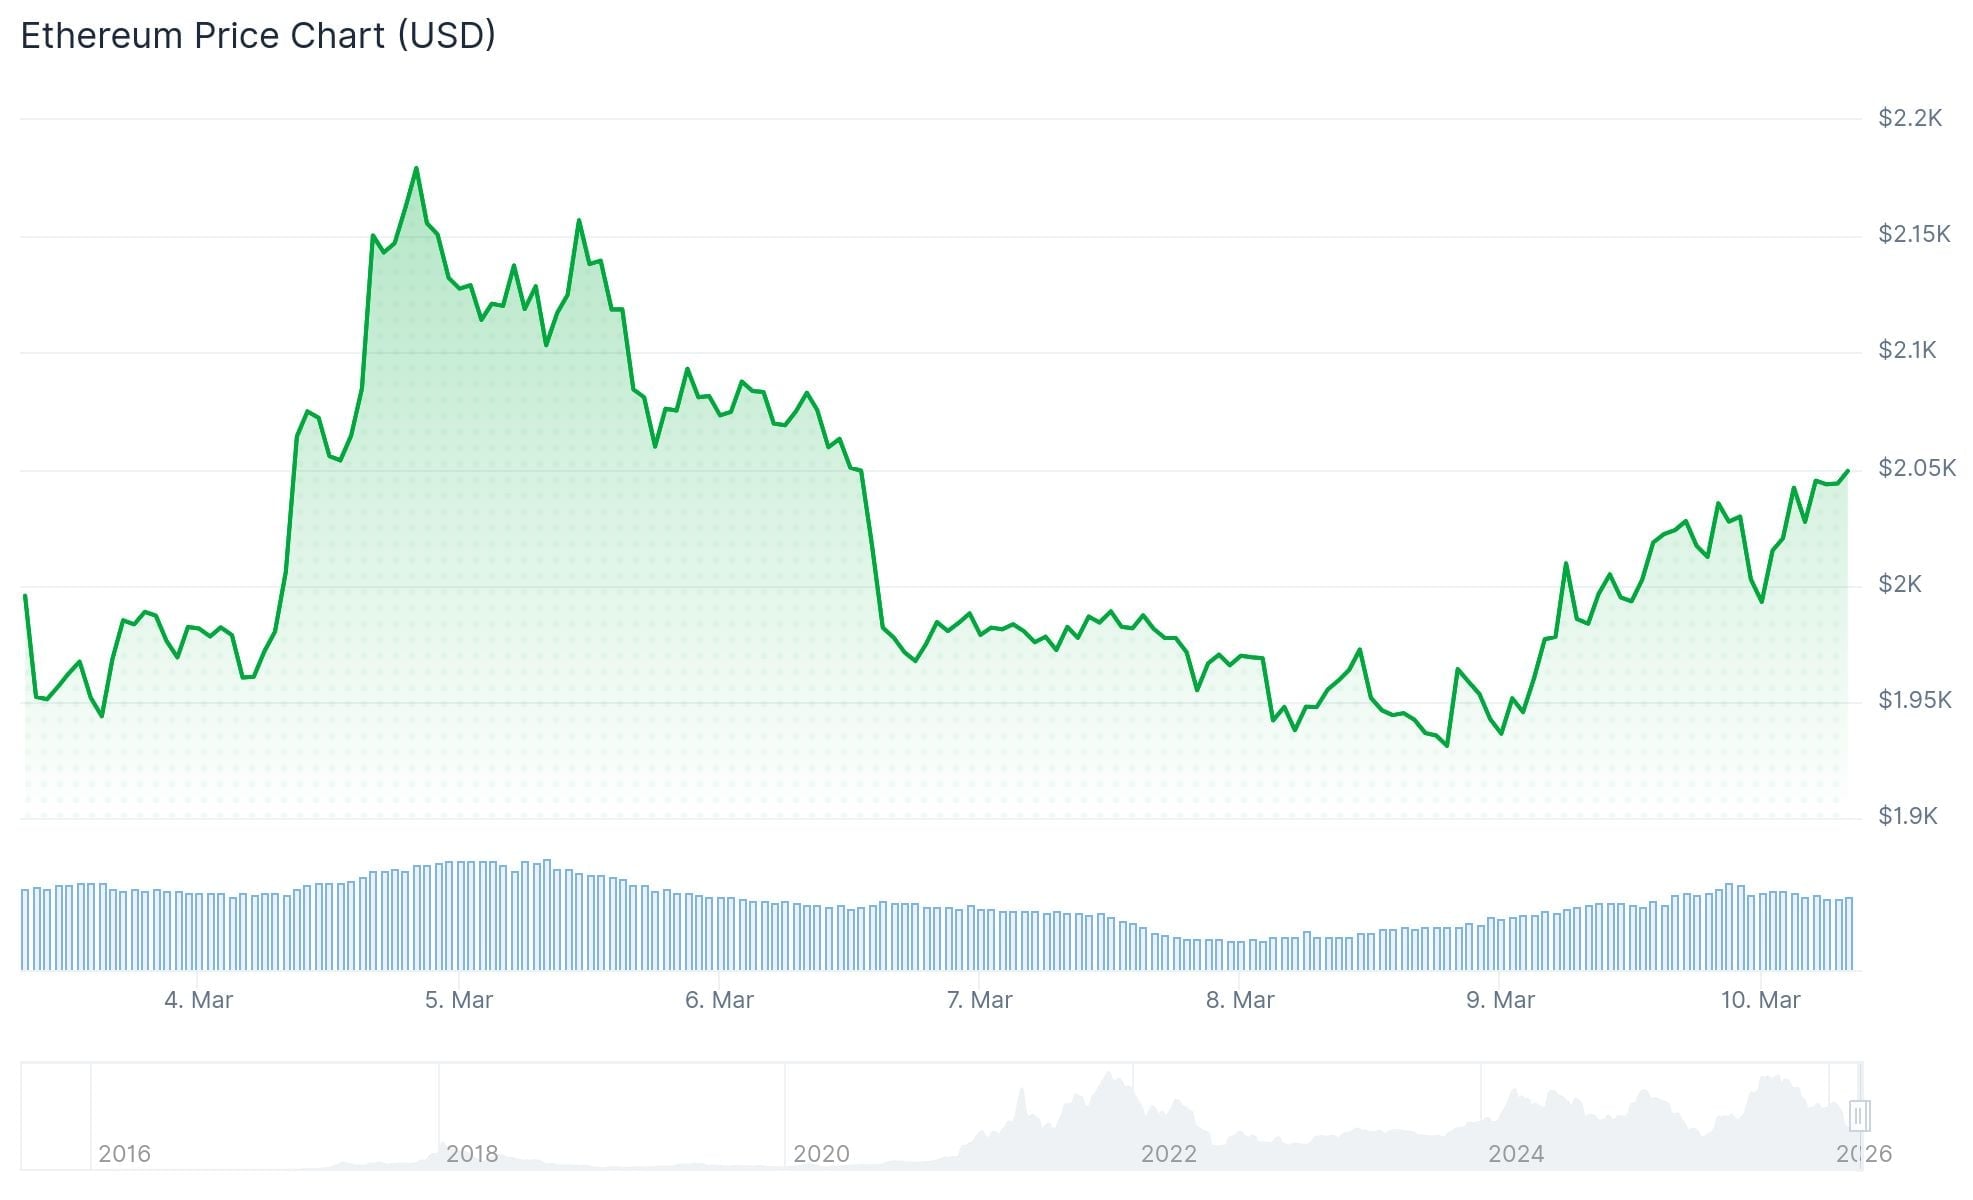
ETH is presently changing hands near $2,050 following a rebound from Sunday’s low around $1,908. Last week saw the cryptocurrency briefly challenge the $2,150 threshold before experiencing a pullback.
Derivative market data from CryptoQuant reveals a net deposit of 110,343 ETH flowing into derivative platforms on March 7, representing the third-highest surge recorded in 2026.
A comparable influx occurred on February 6, immediately preceding a 13% ETH surge from its yearly bottom at $1,736. This historical precedent adds meaningful context to the current market positioning.
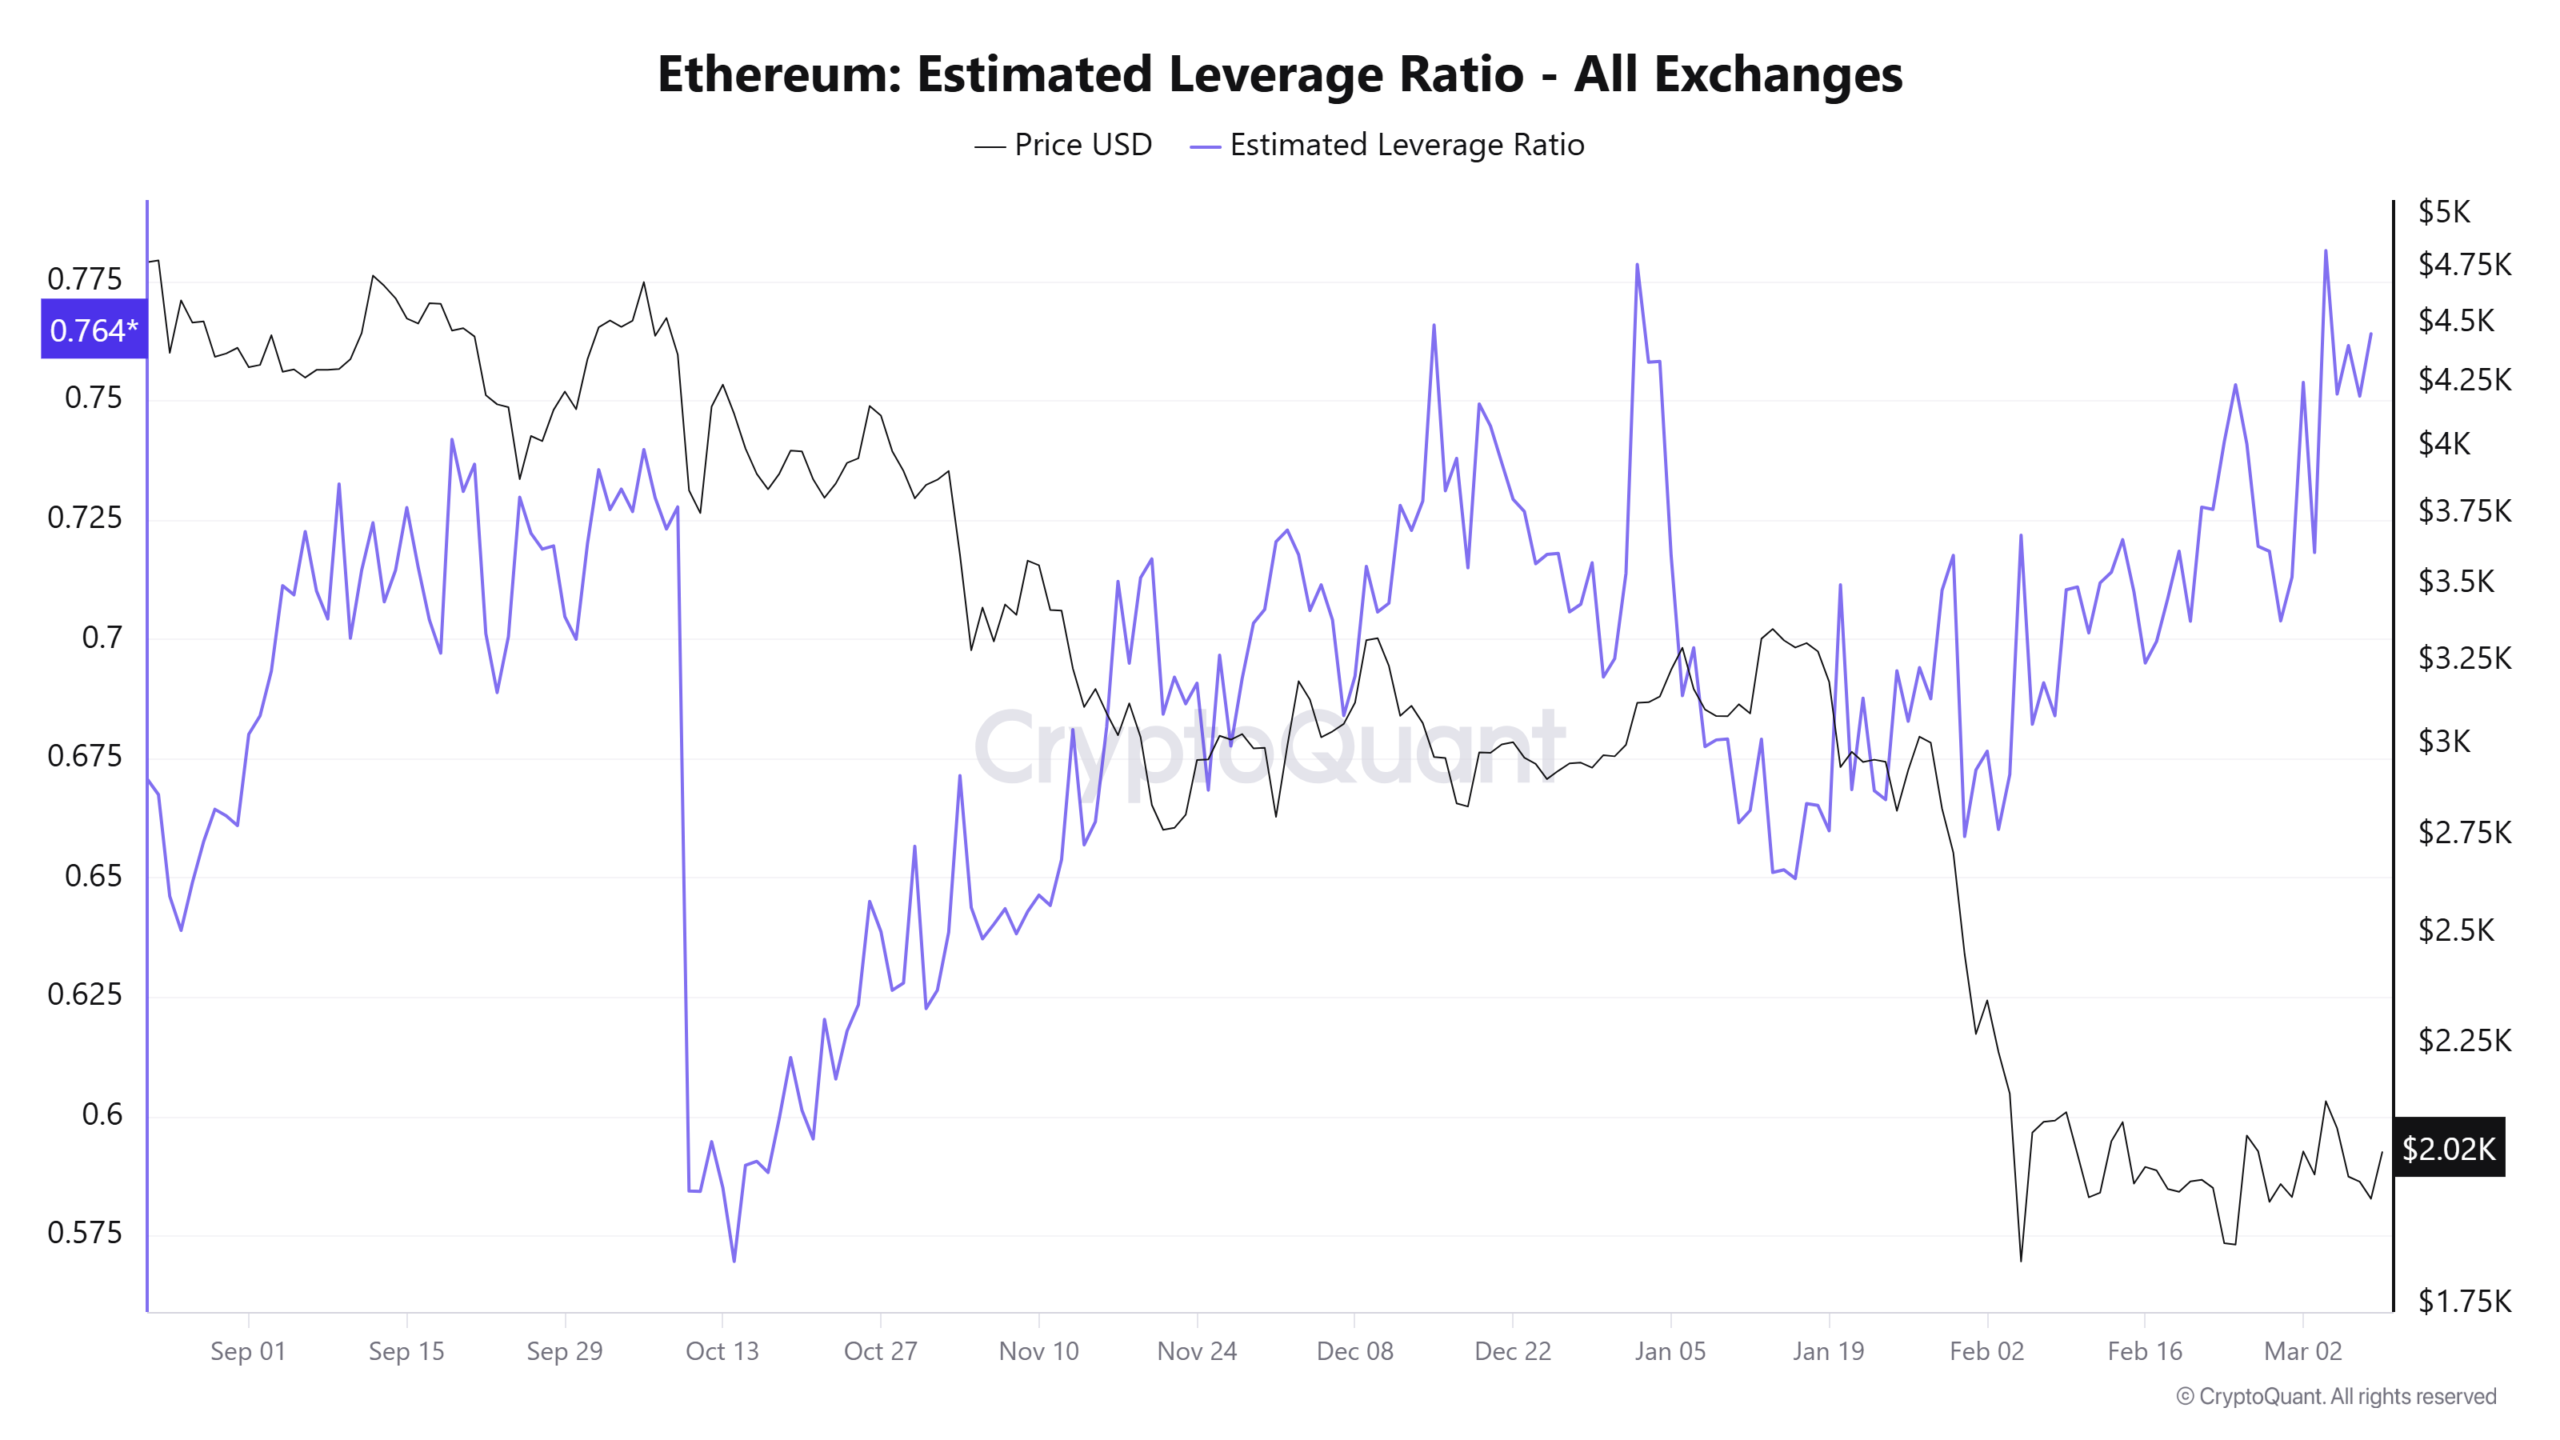
The estimated leverage ratio for Ethereum surged to an all-time high of 0.78 during the current week, surpassing the prior peak of 0.778 recorded on January 1.

This metric calculates the relationship between open interest and exchange reserves. Elevated readings indicate increased utilization of borrowed capital among traders, potentially amplifying price volatility in both directions.
Short Liquidations Could Fuel a Move Higher
According to CoinGlass analytics, approximately $273 million in short position liquidation leverage exists around the $2,030 price point. Such concentrated zones frequently become magnetic price targets.
Should ETH advance into this territory, automatic buybacks triggered by liquidated short sellers could rapidly intensify upward momentum. Market observers characterize this phenomenon as a “liquidity sweep.”
Cryptocurrency analyst Cyril-DeFi observed that ETH is simultaneously testing a long-term ascending support line that has remained intact since the previous market cycle. The analyst emphasized that the $1,900–$2,000 range represents a pivotal zone that may determine the subsequent directional move.
What the Charts Are Saying
The weekly RSI currently registers at 33, positioned marginally above the 30 oversold benchmark. Historical data suggests that readings within this territory have frequently preceded significant upward reversals or accumulation phases.
The Fear & Greed Index presently stands at 13 out of 100, signaling “Extreme Fear.” This sentiment profile resembles conditions that have occasionally foreshadowed trend reversals.
Daily chart analysis shows Ethereum oscillating within a $1,930 to $2,050 range. Neither boundary has experienced a decisive breach thus far.
A confirmed daily close exceeding $2,120 would negate the current near-term bearish structure and could propel prices toward the $2,200–$2,350 zone. The 20-day exponential moving average is positioned near $2,120.
Conversely, if support at $1,930 fails, technical analysts identify $1,760 as the subsequent probable destination, with $1,470 representing a deeper support level established in April 2025.
ETH’s 24-hour trading volume registered $22.4 billion. While selling pressure has diminished, accumulation from buyers has yet to materialize with conviction.
The latest price movements demonstrate ETH sustaining levels above $2,000, with a bullish reversal pattern developing on the one-hour timeframe subsequent to Sunday’s liquidity sweep near $1,908.
Get 3 Free Stock Ebooks
Discover top-performing stocks in AI, Crypto, and Technology with expert analysis.
- Top 10 AI Stocks - Leading AI companies
- Top 10 Crypto Stocks - Blockchain leaders
- Top 10 Tech Stocks - Tech giants

