
 Price Struggles at $2,200 as Macro Headwinds Intensify")
Key Highlights
- Ethereum declined 6% following a brief spike to $2,200, pressured by equity market selloffs and geopolitical tensions in the Middle East
- Options market data shows a 7% skew toward puts, indicating traders are positioning for potential downside
- US-based Ethereum spot ETFs experienced $91 million in net outflows on March 5
- The validator entry queue expanded to 3.4 million ETH while the exit queue contracted to 58,944 ETH
- Ethereum maintains dominance with 65% of blockchain TVL across its ecosystem, including $55.4B on the main chain
Ethereum is currently changing hands near $2,080 following its inability to sustain levels above $2,200 earlier this week. The pullback occurred amid deteriorating global risk appetite, influenced by escalating tensions involving Iran and a US court decision mandating the government to return over $130 billion in tariff payments to domestic corporations.
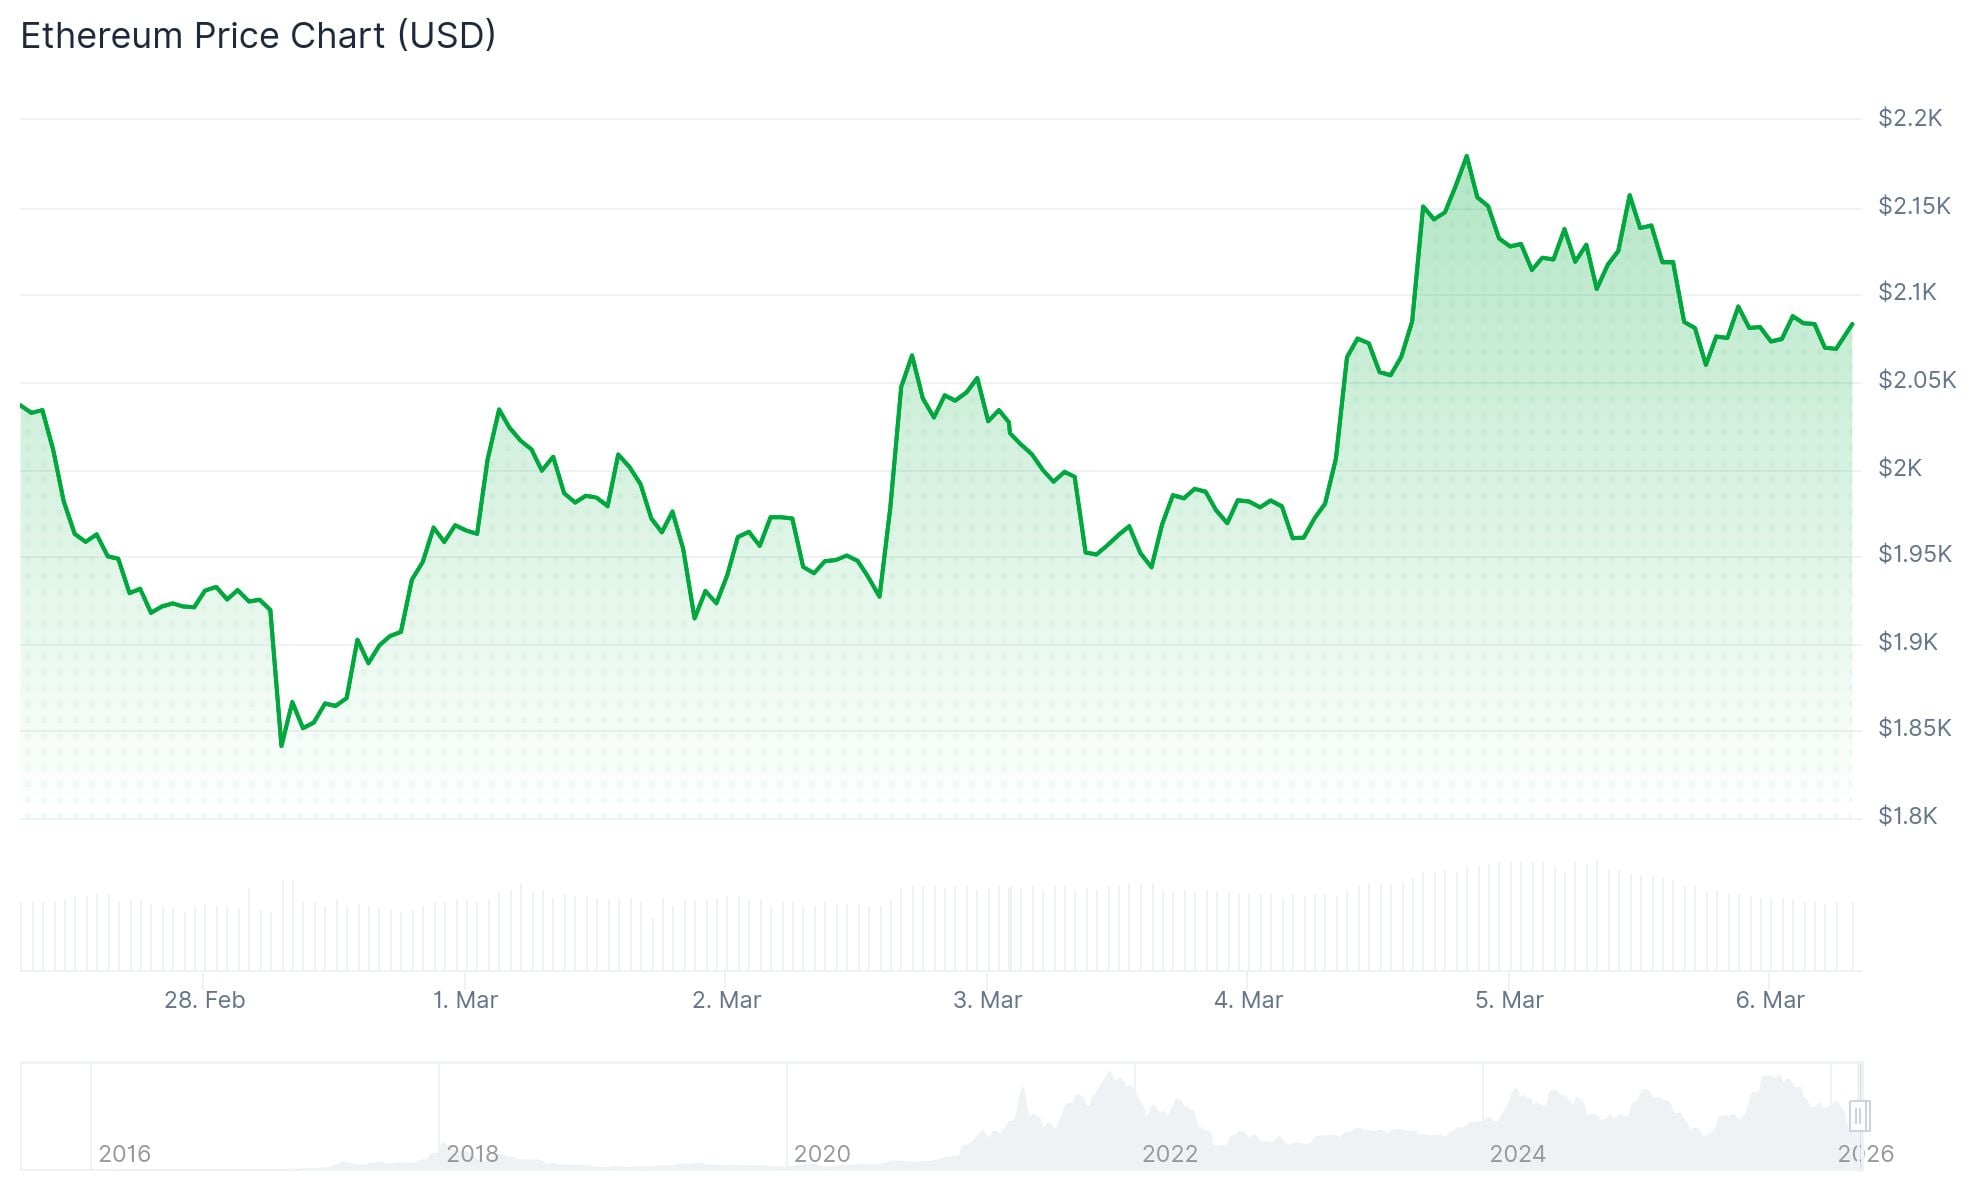
The second-largest cryptocurrency had staged a 22% recovery from its February trough of $1,800, but bullish momentum quickly evaporated. Following a temporary advance to $2,200 on Wednesday, ETH experienced a 6% correction that aligned with declining US stock indices.
The annualized premium on 30-day ETH futures contracts currently trades significantly beneath the 5% neutral benchmark. This indicates limited appetite for leveraged long positions among market participants.
The options market’s put-call skew reached 7% on Thursday. Historical data suggests that readings exceeding 6% typically reflect institutional traders purchasing downside protection.
Liquidation data from CoinGlass shows ETH traders faced $58 million in forced position closures over the past 24 hours, with long positions accounting for $35.7 million of that total.

Institutional Flows and Validator Trends
The price action was accompanied by bearish ETF metrics. March 5 saw US spot Ethereum ETFs register cumulative net outflows totaling $91 million, indicating a temporary withdrawal of institutional capital.
This development came after several days of positive inflows earlier in the week, demonstrating how rapidly investor sentiment responds to changing market dynamics.
Meanwhile, validator queue metrics painted a contrasting picture. The entry queue expanded to approximately 3.4 million ETH, while the exit queue dropped to merely 58,944 ETH. Prospective validators now face waiting periods extending to 57 days.
This data indicates that major ETH holders are choosing to stake their assets for yield generation rather than liquidating positions during market turbulence.
On-Chain Metrics and Ecosystem Dominance
Decentralized exchange activity on Ethereum declined to $12.6 billion in weekly volume, down from $20.2 billion recorded 30 days prior. Revenue generated by Ethereum-based decentralized applications fell to $14.1 million over the past week, representing a 47% month-over-month decrease.
Solana experienced comparable trends, with its DEX volumes contracting by 50% during the same monthly period.
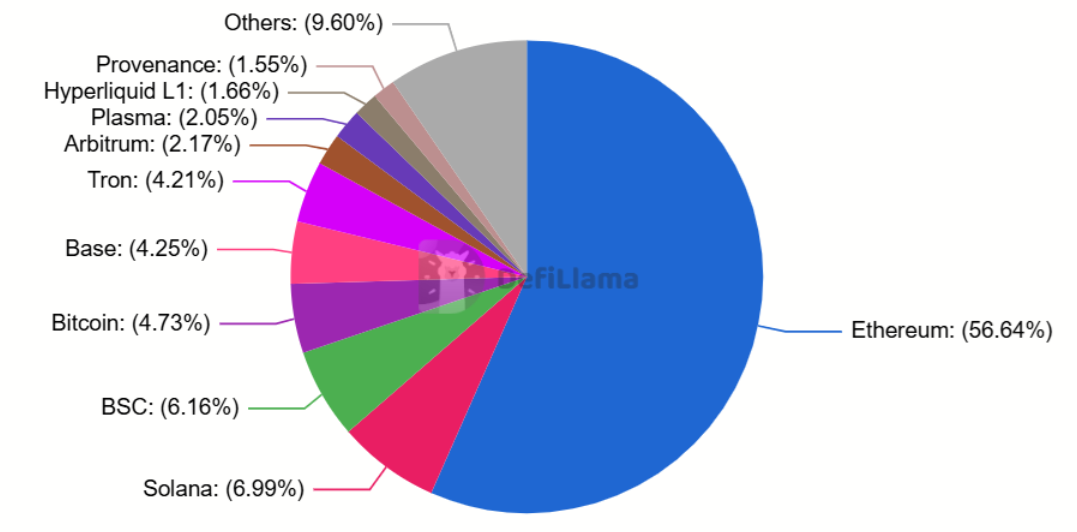
Despite reduced on-chain engagement, Ethereum continues to command the largest share of total value locked across the blockchain landscape. When factoring in layer-2 solutions, the Ethereum infrastructure accounts for roughly 65% of aggregate blockchain TVL. The primary layer alone secures $55.4 billion, vastly outpacing Solana’s $6.8 billion.
Immediate resistance is positioned at $2,108 on daily timeframes. Successfully clearing this barrier could pave the way toward $2,388. Conversely, a breach of support at $1,741 would expose deeper levels at $1,524 and $1,404.
Technical analysts have identified $1,826 as the lower boundary of the current range structure, serving as a potential downside target if selling momentum persists.
Get 3 Free Stock Ebooks
Discover top-performing stocks in AI, Crypto, and Technology with expert analysis.
- Top 10 AI Stocks - Leading AI companies
- Top 10 Crypto Stocks - Blockchain leaders
- Top 10 Tech Stocks - Tech giants

