
 Price: Technical Indicators and ETF Inflows Signal Potential Breakout")
TLDR
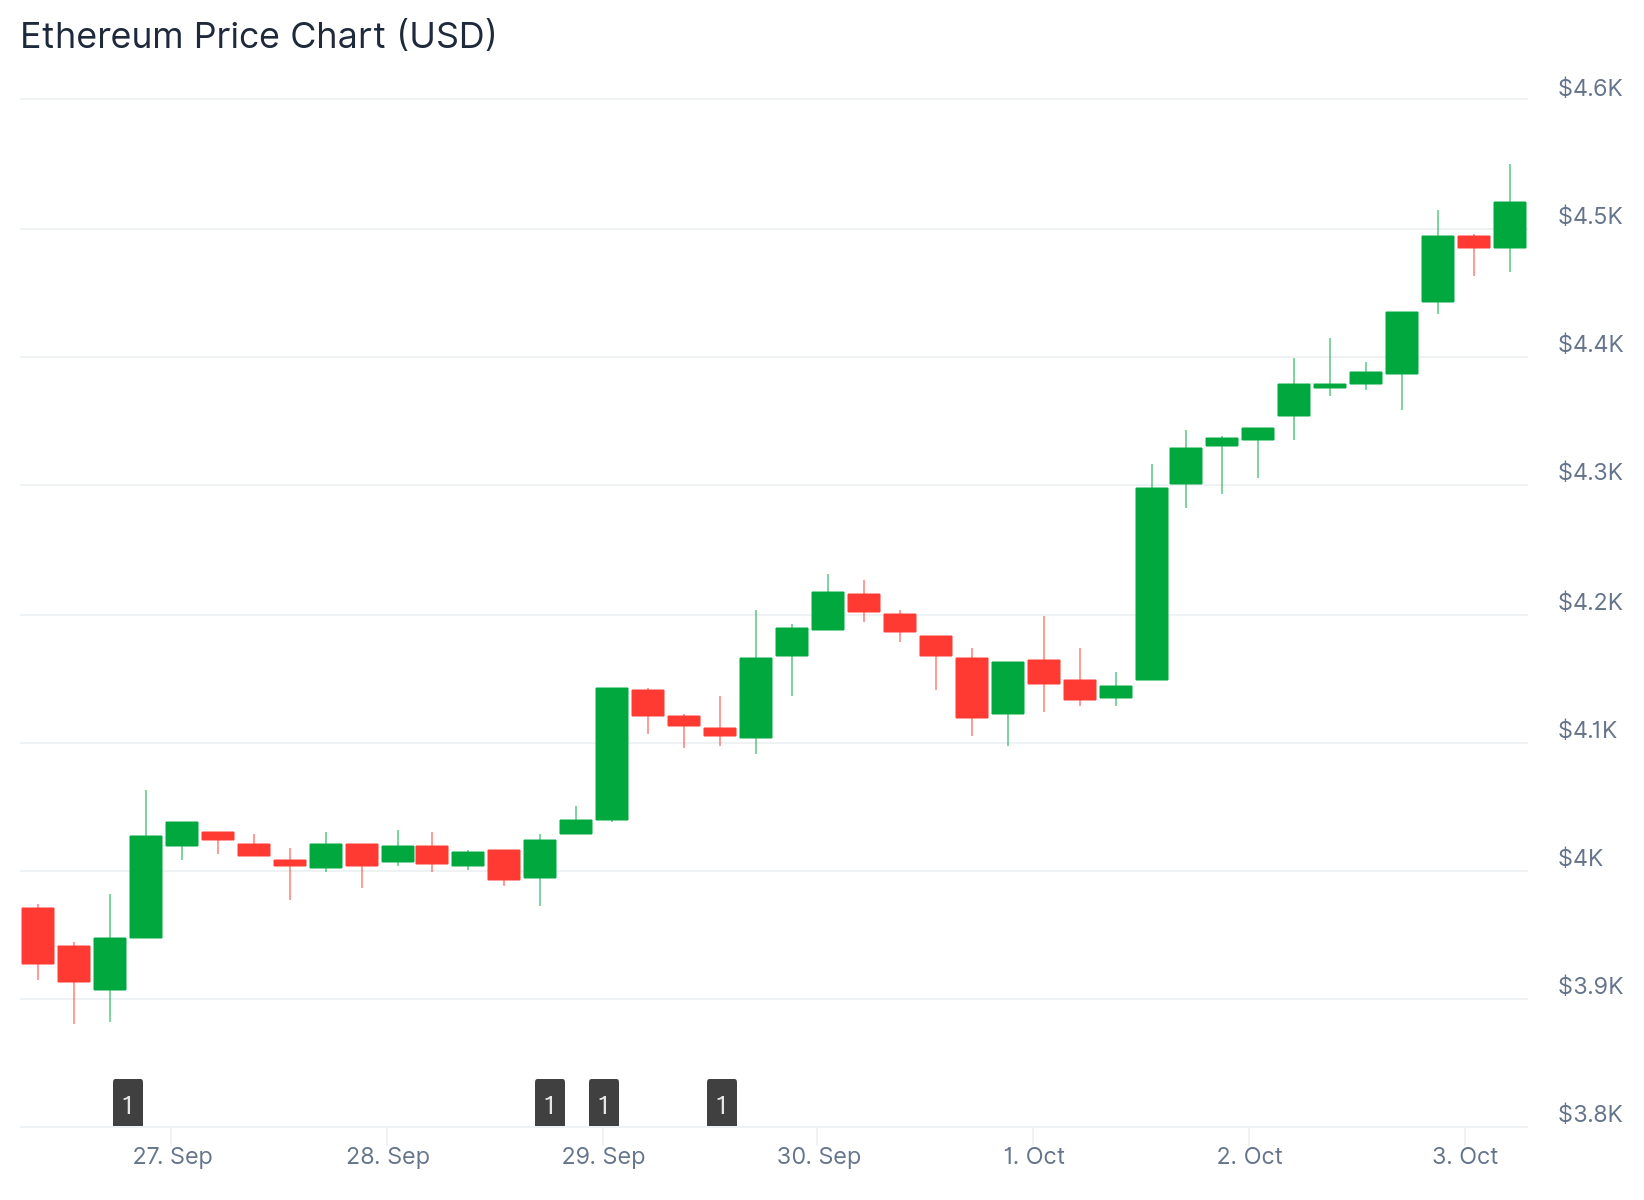
- Ethereum established a local bottom at $3,900 before recovering to trade near $4,146
- Spot Ethereum ETFs recorded $547 million in net inflows on September 29, with Fidelity and BlackRock leading purchases
- Derivatives data shows long-to-short ratio of 1.8 on Binance with open interest near $56 billion
- Technical analysis identifies Power of 3 pattern that previously generated 145% returns
- Key resistance levels sit at $4,275 and $4,450, with support holding between $4,100 and $4,175
Ethereum traded at $4,146 at press time, down 1% over the previous 24 hours. The price recovered after briefly dropping below $4,000 in recent trading sessions.
Technical analysts identified a Power of 3 pattern on ETH charts. This accumulation-manipulation-distribution setup previously drove Ethereum from $2,000 to $4,900 between May and June 2025.
The pattern shows three distinct phases. Buyers accumulated between $4,800 and $4,200 before a quick drop pushed prices below $4,000.

Market observers view this move as a liquidity sweep. The drop cleared orders around $4,180 and aligned with a daily fair value gap.
The recent low below $3,900 appears to function as a floor. Both the 25-day and 50-day simple moving averages currently act as resistance levels.
Institutional Buying Through ETF Products
Spot Ethereum ETFs attracted $80 million on October 01. This reversed several consecutive days of net outflows.

Studies show that $100 million in ETF inflows typically lift spot prices by 0.3% to 0.7%. This correlation suggests institutional flows impact short-term price action.
The buying wave provided support during broader market volatility. Consistent inflows help reduce downside pressure and stabilize trading ranges.
Derivatives Markets Show Increased Activity
The long-to-short ratio on Binance reached 1.8. Top traders demonstrated stronger conviction with a 2.7 ratio.
Open interest in Ethereum futures held near $56 billion. Daily futures volumes increased 38% to $72 billion.
Options activity jumped 50% during the same period. These metrics indicate traders expect larger price movements ahead.
However, open interest rose only marginally while price gained 15% over one week. This suggests the rally is not heavily driven by leverage yet.
Spot cumulative volume delta declined during the price rise. This indicates net selling pressure on spot markets despite upward price movement.
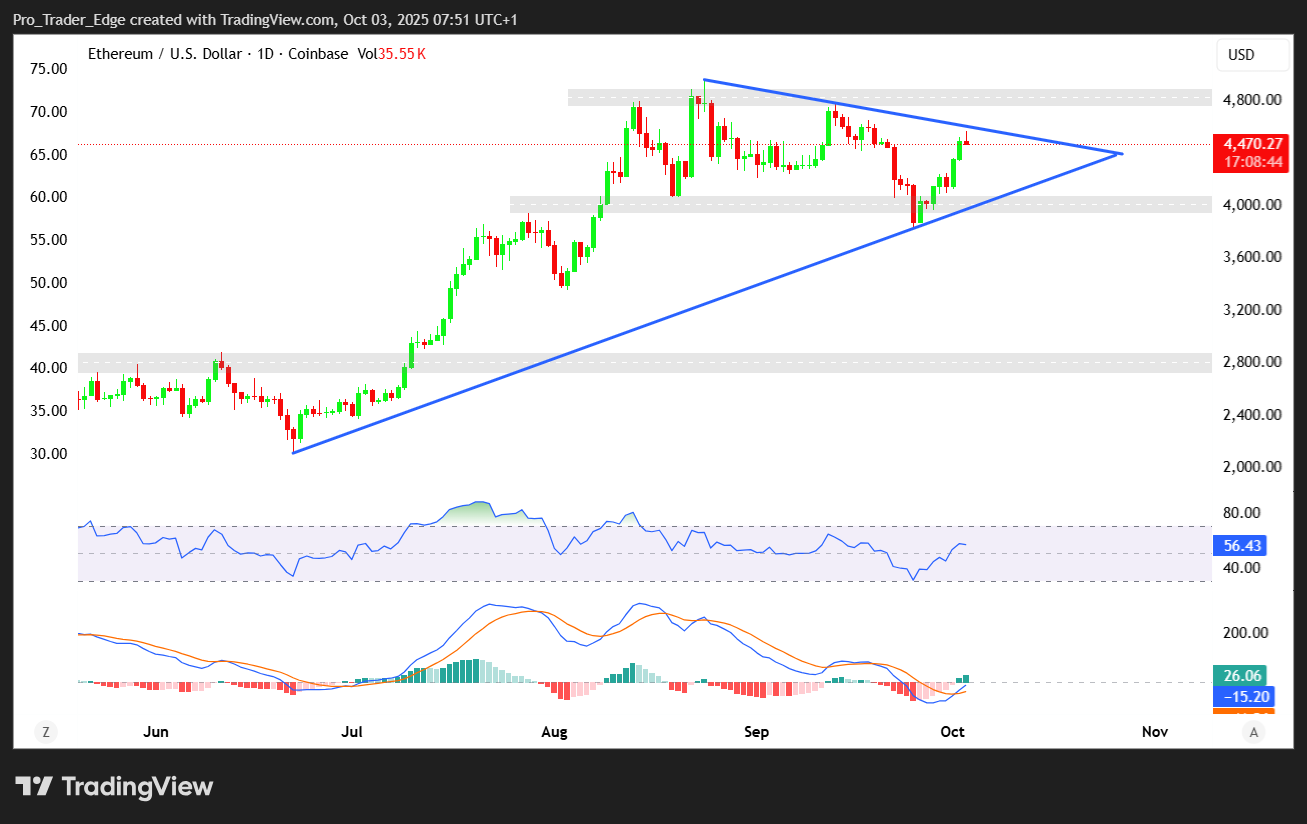
Chart analysis places immediate resistance at $4,275. Additional upside targets appear at $4,450 and $4,800.
Medium-term projections point to $5,766 if momentum continues. Support levels remain between $4,100 and $4,175.
Path Forward for ETH Price
The Relative Strength Index showed improvement at press time. A confirmed daily close above $4,300 would signal a structural shift.
Analysts project potential gains of 80% to 100% through the fourth quarter. This would match the magnitude seen in the earlier 2025 rally.
Ethereum trades below a descending resistance trendline from September highs. Breaking above this level is viewed as critical for sustained upside.
A near-term zone of interest exists between $4,100 and $4,250. Price moved quickly through this area without balanced buyer-seller interaction.
If bullish momentum fails to push above $4,500 in coming days, this zone could serve as a retracement target. The area shows dense liquidity clustering and volume inefficiencies.
Ethereum’s next move depends on sustained ETF participation and technical confirmation above key resistance. Institutional buying combined with growing derivatives exposure suggests potential for testing higher targets.
Get 3 Free Stock Ebooks
Discover top-performing stocks in AI, Crypto, and Technology with expert analysis.
- Top 10 AI Stocks - Leading AI companies
- Top 10 Crypto Stocks - Blockchain leaders
- Top 10 Tech Stocks - Tech giants

