
 Slides to $2,100 as MVRV Signals Historic Accumulation Zone")
Key Highlights
- ETH’s MVRV ratio has fallen into the 0.8–1.0 range, a zone historically associated with significant value resets before major rallies
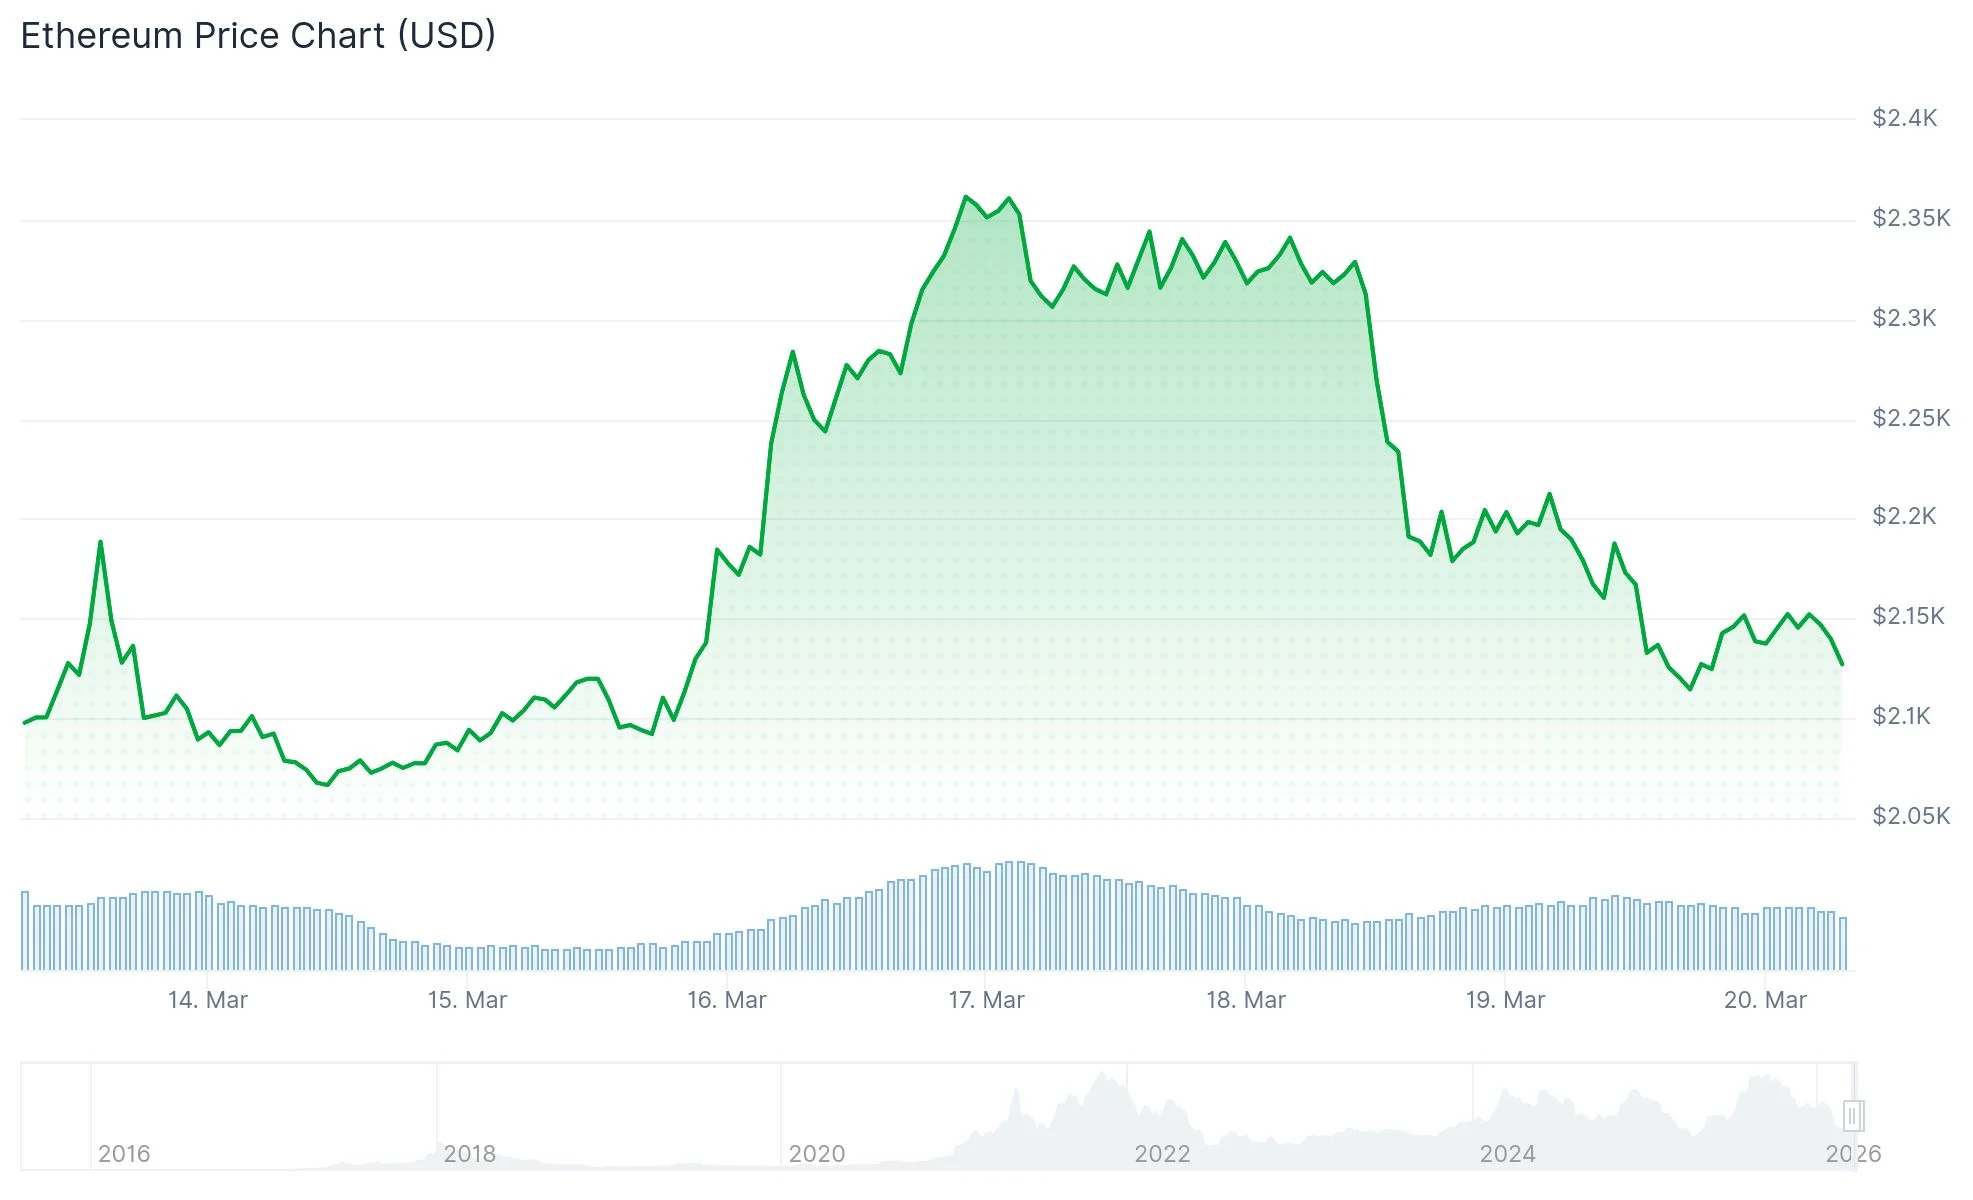
- Ethereum faced strong resistance at $2,400 and subsequently declined to $2,100
- Current trading activity remains below the $2,200 level and beneath the 100-hourly Simple Moving Average
- Critical near-term support is positioned between $2,100 and $2,150, with additional backing around $1,770 should the primary zone fail
- Breaking above $2,200 could trigger upward movement toward $2,240, $2,275, and potentially $2,385
Ethereum has declined to approximately $2,100 following a significant pullback from the $2,385 zone. The cryptocurrency breached multiple support levels at $2,320 and $2,250, while also breaking below a critical ascending trend line that had provided support near $2,160 on the hourly timeframe.
The recent session low touched $2,100. ETH is now consolidating marginally above this level, positioned beneath the 23.6% Fibonacci retracement level calculated from the $2,385 peak to the $2,100 bottom.
Additionally, Ethereum is trading underneath the 100-hourly Simple Moving Average, reinforcing the current bearish technical posture in the near term.
Immediate resistance emerges at $2,165, with the next significant barrier at $2,200, where the 100-hourly SMA is currently positioned. Reclaiming territory above $2,200 represents the initial requirement for any meaningful recovery scenario.
Should Ethereum successfully breach $2,200, subsequent resistance zones include $2,240, which corresponds to the 50% Fibonacci retracement level, followed by $2,275 and $2,320. A more robust rally could potentially extend toward $2,385.

Conversely, if the $2,100 support level fails to hold, additional support appears at $2,060 and $2,020. The $2,000 psychological level is considered the primary defense zone.
MVRV Metric Signals Potential Value Territory
From a broader market perspective, Ethereum’s MVRV ratio has declined into the 0.8 to 1.0 range. Based on analysis from Ali Charts utilizing Glassnode data, this territory has historically preceded substantial multi-month recovery periods.
https://twitter.com/alicharts/status/2034559606668570900?s=20
Historical recoveries from this MVRV zone have produced gains spanning approximately 129% to over 5,000%, though each market cycle unfolded under unique macroeconomic and market conditions. While this indicator doesn’t guarantee an immediate price reversal, it suggests that potential downside risk from current levels may be considerably more constrained compared to previous peak valuations.
ETH achieved a cycle peak near $4,955 before entering this corrective phase. The present price level around $2,100 reflects a decline exceeding 57% from that all-time high.
Technical Analyst Highlights $2,150 as Critical Pivot
Market analyst Ted Pillows shared insights on X regarding Ethereum’s present technical configuration. He observed that ETH experienced a decisive rejection at the $2,400 resistance zone and is currently retesting $2,150 as a potential support area.
https://twitter.com/TedPillows/status/2034554720593772615?s=20
The technical chart presented by Ted Pillows illustrates a pattern of descending peaks, with successive attempts to rally failing to achieve substantial upward momentum. This formation suggests that additional downside remains possible if the support zone is breached.
The $2,150 area corresponds with a previous consolidation region and is being closely monitored as a short-term inflection point for directional bias.
Get 3 Free Stock Ebooks
Discover top-performing stocks in AI, Crypto, and Technology with expert analysis.
- Top 10 AI Stocks - Leading AI companies
- Top 10 Crypto Stocks - Blockchain leaders
- Top 10 Tech Stocks - Tech giants

